HOWTO run a small change between two elasticsearch
Why do that
With Punchplatform, you have usually data in an Elasticsearch Cluster.
Elasticsearch provides a way to reindex data when mapping must be updated. For instance: Long to Date, or String not analyzed to analyzed String.
Sometimes, you need to update the data itself, that's why punchplatform provides a way to update the data itself. For instance: change timestamps or enrich data.
Update timestamp - use case
Use case description:
Add a year to a specific timestamp field on a subset of data.
STEP 0 - Identify data
Identify the subset of data with Kibana:
- timestamp range
- type of logs
- indices name
Then, read the data selected, with an Elasticsearch Spout and print the result.
The following example show an extraction of logs of all tenants logs from 2018/01/12 9h to 2018/01/13 18h with the timestamp of the reporter (rep.ts). You can start in foreground the following topology:
{
  "tenant" : "mytenant",
  "channel" : "replay_es",
  "name" : "single",
  "meta" : {
    "tenant" : "mytenant",
    "channel" : "replay_es",
    "vendor" : "replay_es"
  },
  "spouts" : [
     {
          "type" : "extraction_input",
          "settings" : {
            "index" : "events-*",
            "query": "?q=_type:log",
            "elastic_settings" : {
              "es.index.read.missing.as.empty": true
            }
          },
          "storm_settings" : {
            "component" : "extractor_spout"
          }
      }
  ],
  "bolts" : [
    {
      "type" : punchlet_node",
      "settings" : {
        "punchlet_code": "{print(root);}"
      },
      "storm_settings" : {
        "executors": 1,
        "component" : punchlet_node",
        "publish" : [
          {
            "stream" : "logs",
            "fields" : [
              "log",
              "es_type",
              "log_id",
              "es_index"
            ]
          }
        ],
        "subscribe" : [
          {
            "component" : "extractor_spout",
            "stream" : "default",
            "grouping": "localOrShuffle"
          }
        ]
      }
    },
  ],

  "exception_catcher_bolt" : {
    "punchlet" : "standard/common/exception_handler.punch",
    "executors" : 1
  },

  "storm_settings" : {
      "metrics_consumers": [ "org.apache.storm.metric.LoggingMetricsConsumer" ],
      "topology.builtin.metrics.bucket.size.secs": 30,
      "supervisor.monitor.frequency.secs" : 60,
      "topology.max.spout.pending" : 2000,
      "topology.enable.message.timeouts": true,
      "topology.message.timeout.secs" : 30,
      "topology.worker.childopts" : "-Xms256m -Xmx256m",
      "topology.receiver.buffer.size": 32,
      "topology.executor.receive.buffer.size": 16384,
      "topology.executor.send.buffer.size": 16384,
      "topology.transfer.buffer.size": 32,
      "topology.worker.shared.thread.pool.size": 4,
      "topology.disruptor.wait.strategy": "com.lmax.disruptor.BlockingWaitStrategy",
      "topology.spout.wait.strategy": "org.apache.storm.spout.SleepSpoutWaitStrategy",
      "topology.sleep.spout.wait.strategy.time.ms": 50,
      "topology.workers" : 1
  }
}
If you meet errors or issues. Check regulars errors, reread the configuration (especially index name and timestamp fields). Then, contact support-n3.punchplatform@thalesgroup.com for help.
STEP 1 - Design your process
Use your favorite tool to design your small processing:
- punchplatform online debugger
- punchplatform-log-injector.sh --punchlets
- punchplatform-puncher.sh
The goal is to be focused on data only. Forget elasticsearch storm etc... Punch and data focus only.
For example, I have try to add a year do a date with the online punch debugger using :
{
  java.time.ZonedDateTime date = java.time.ZonedDateTime.parse("2018-01-11T15:05:00+01:00", java.time.format.DateTimeFormatter.ISO_OFFSET_DATE_TIME);
  [initialDate] = date.toString();

  java.time.Period year = java.time.Period.ofYears(1);
  java.time.ZonedDateTime datePlusYear = date.plus(year);
  [datePlusYear] = datePlusYear.toString();

  print(root);
}
Then, write your processing in a punch. For my example, it looks like:
{
  // get date from logs ie [logs][log][rep][ts]
  java.time.ZonedDateTime date = java.time.ZonedDateTime.parse([logs][log][rep][ts].toString(), java.time.format.DateTimeFormatter.ISO_OFFSET_DATE_TIME);
  //[initialDate] = date.toString();

  // define 1 year, no matter leap year or not
  java.time.Period year = java.time.Period.ofYears(1);

  // add 1 year
  java.time.ZonedDateTime datePlusYear = date.plus(year);

  // update [logs][log][rep][ts] with the updated date
  [logs][log][rep][ts] = datePlusYear.toString();

}
STEP 2 - Start your processing in production
Assemble the reading component, the processing component and the last component, the writing component, like the following example:
{
    "tenant" : "mytenant",
    "channel" : "replay_es",
    "name" : "single",
    "meta" : {
      "tenant" : "mytenant",
      "channel" : "replay_es",
      "vendor" : "replay_es"
    },
    "spouts" : [
      {
            "type" : "elasticsearch_input",
            "settings" : {
              "es_client_type" : "client",
              "es_cluster_name" : "es_search",
              "es_cluster_nodes_and_ports" : "localhost:9300",
              "index_name" : "events-mytenant-*",
              "from_datetime" : "2018-01-12T09:00:00+0100",
              "to_datetime" : "2018-01-13T18:00:00+0100",
              "timestamp_field" : "rep.ts",
              "timeslice_size_ms" : 60000,
              "filtering_request" : "_type:",
              "es_id_storm_output_field_name" : "log_id",
              "es_type_storm_output_field_name" : "es_type",
              "es_document_storm_output_field_name" : "log",
              "es_index_storm_output_field_name" : "es_index"
            },
            "storm_settings" : {
              "executors": 1,
              "component" : "extractor_spout",
              "publish" : [
                {
                  "stream" : "logs" ,

                  "fields" : ["log","es_type", "log_id", "es_index"]
                }
              ]
            }
        }
    ],

    "bolts" : [
      {
        "type" : punchlet_node",
        "settings" : {
          "punchlet_json_resources" : [],
          "punchlet" : [
            "replay_es/removeTs.punch",
            "replay_es/plusOneYear.punch"
          ]
        },
        "storm_settings" : {
          "executors": 1,
          "component" : punchlet_node",
          "publish" : [
            {
              "stream" : "logs",
              "fields" : [
                "log",
                "es_type",
                "log_id",
                "es_index"
              ]
            }
          ],
          "subscribe" : [
            {
              "component" : "extractor_spout",
              "stream" : "logs",
              "grouping": "localOrShuffle"
            }
          ]
        }
      },
      {
        "type": "elasticsearch_bolt",
        "settings": {
          "cluster_id": "es_search",
          "per_stream_settings" : [
            {
              "stream" : "logs",
              "index" : { "type" : "daily" , "prefix" : "events-%{tenant}-" },
              "document_json_field" : "log",
              "document_id_field" : "log_id",
            }
          ]
        },
        "storm_settings": {
          "component": "elasticsearch",
          "subscribe": [ { "component": punchlet_node", "stream": "logs", "grouping" : "localOrShuffle" } ]
        }
      }
    ],

    "metrics" : {
        "reporters" : [
            {
              "type" : "elasticsearch",
              "cluster_name" : "es_search",
              "transport" :
              "localhost:9300",
              "max_results_size" : 10000,
              "native_es_settings" : {
                "transport.netty.workerCount" : "1"
              },
              "reporting_interval" : 1
            }
        ]
    },

    "exception_catcher_bolt" : {
      "punchlet" : "standard/common/exception_handler.punch",
      "executors" : 1
    },

    "storm_settings" : {
        "metrics_consumers": [ "org.apache.storm.metric.LoggingMetricsConsumer" ],
        "topology.builtin.metrics.bucket.size.secs": 30,
        "supervisor.monitor.frequency.secs" : 60,
        "topology.max.spout.pending" : 2000,
        "topology.enable.message.timeouts": true,
        "topology.message.timeout.secs" : 30,
        "topology.worker.childopts" : "-Xms256m -Xmx256m",
        "topology.receiver.buffer.size": 32,
        "topology.executor.receive.buffer.size": 16384,
        "topology.executor.send.buffer.size": 16384,
        "topology.transfer.buffer.size": 32,
        "topology.worker.shared.thread.pool.size": 4,
        "topology.disruptor.wait.strategy": "com.lmax.disruptor.BlockingWaitStrategy",
        "topology.spout.wait.strategy": "org.apache.storm.spout.SleepSpoutWaitStrategy",
        "topology.sleep.spout.wait.strategy.time.ms": 50,
        "topology.workers" : 1
    }
}
We have to start in a cluster, so we need a channel_structure like this:
{
    "topologies" : [
        {
            "topology" : "single_topology.json",
            "execution_mode" : "cluster",
            "cluster" : "main",
            "reload_action" : "kill_then_start"
        }
    ],
    "autotest_latency_control" : {
        "path_controls" : {
            "to_elasticsearch" : {
                "input" : {
                    "pp_platform_id" : "punchplatform-primary",
                    "tenant_name" : "mytenant",
                    "channel_name" : "replay_es",
                    "topology_name" : "single",
                    "storm_container_id" : "main",
                    "component_name" : "extractor_spout"
                },
                "output" : {
                    "pp_platform_id" : "punchplatform-primary",
                    "tenant_name" : "mytenant",
                    "channel_name" : "replay_es",
                    "topology_name" : "single",
                    "storm_container_id" : "main",
                    "component_name" : "elasticsearch"
                },
                "warn_threshold_s" : 2,
                "error_threshold_s" : 4
            }
        }
    },
    "metrics" : {
        "metrics_source" : {
            "configuration" : {
                "type" : "elasticsearch",
                "cluster_name" : "es_search",
                "transport" : "localhost:9300",
                "native_es_settings" : {
                    "transport.netty.workerCount" : "1"
                }
            }
        }
    },
    "kafka_topics" : {}
}
To start, simply run:
channelctl start --channel replay_es
STEP 3 - Administrate and Monitor
Punchplatform provides several way to monitor the kind of processing.
To monitor the high level of the job:
- Channels tab in punchplatform admin to see latency control health
- Jobs tab in punchplatform admin to see the health and a high level progress.
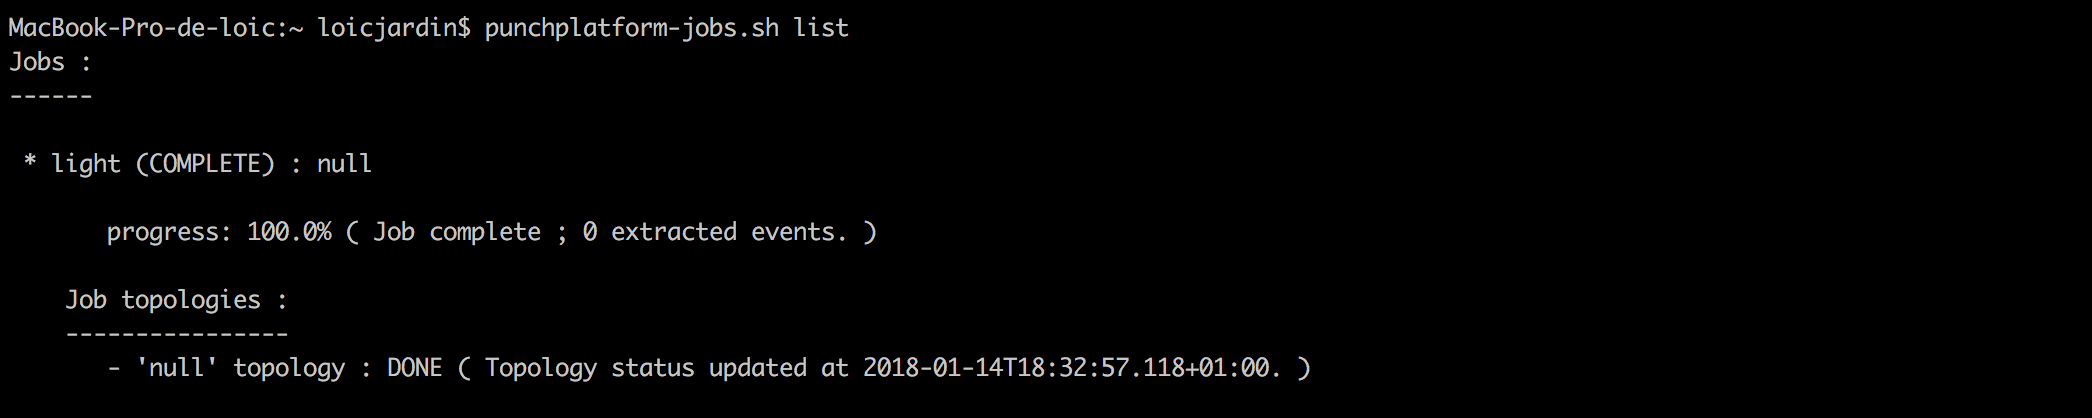
- punchplatform-jobs.sh command
To monitor the low level of the job:
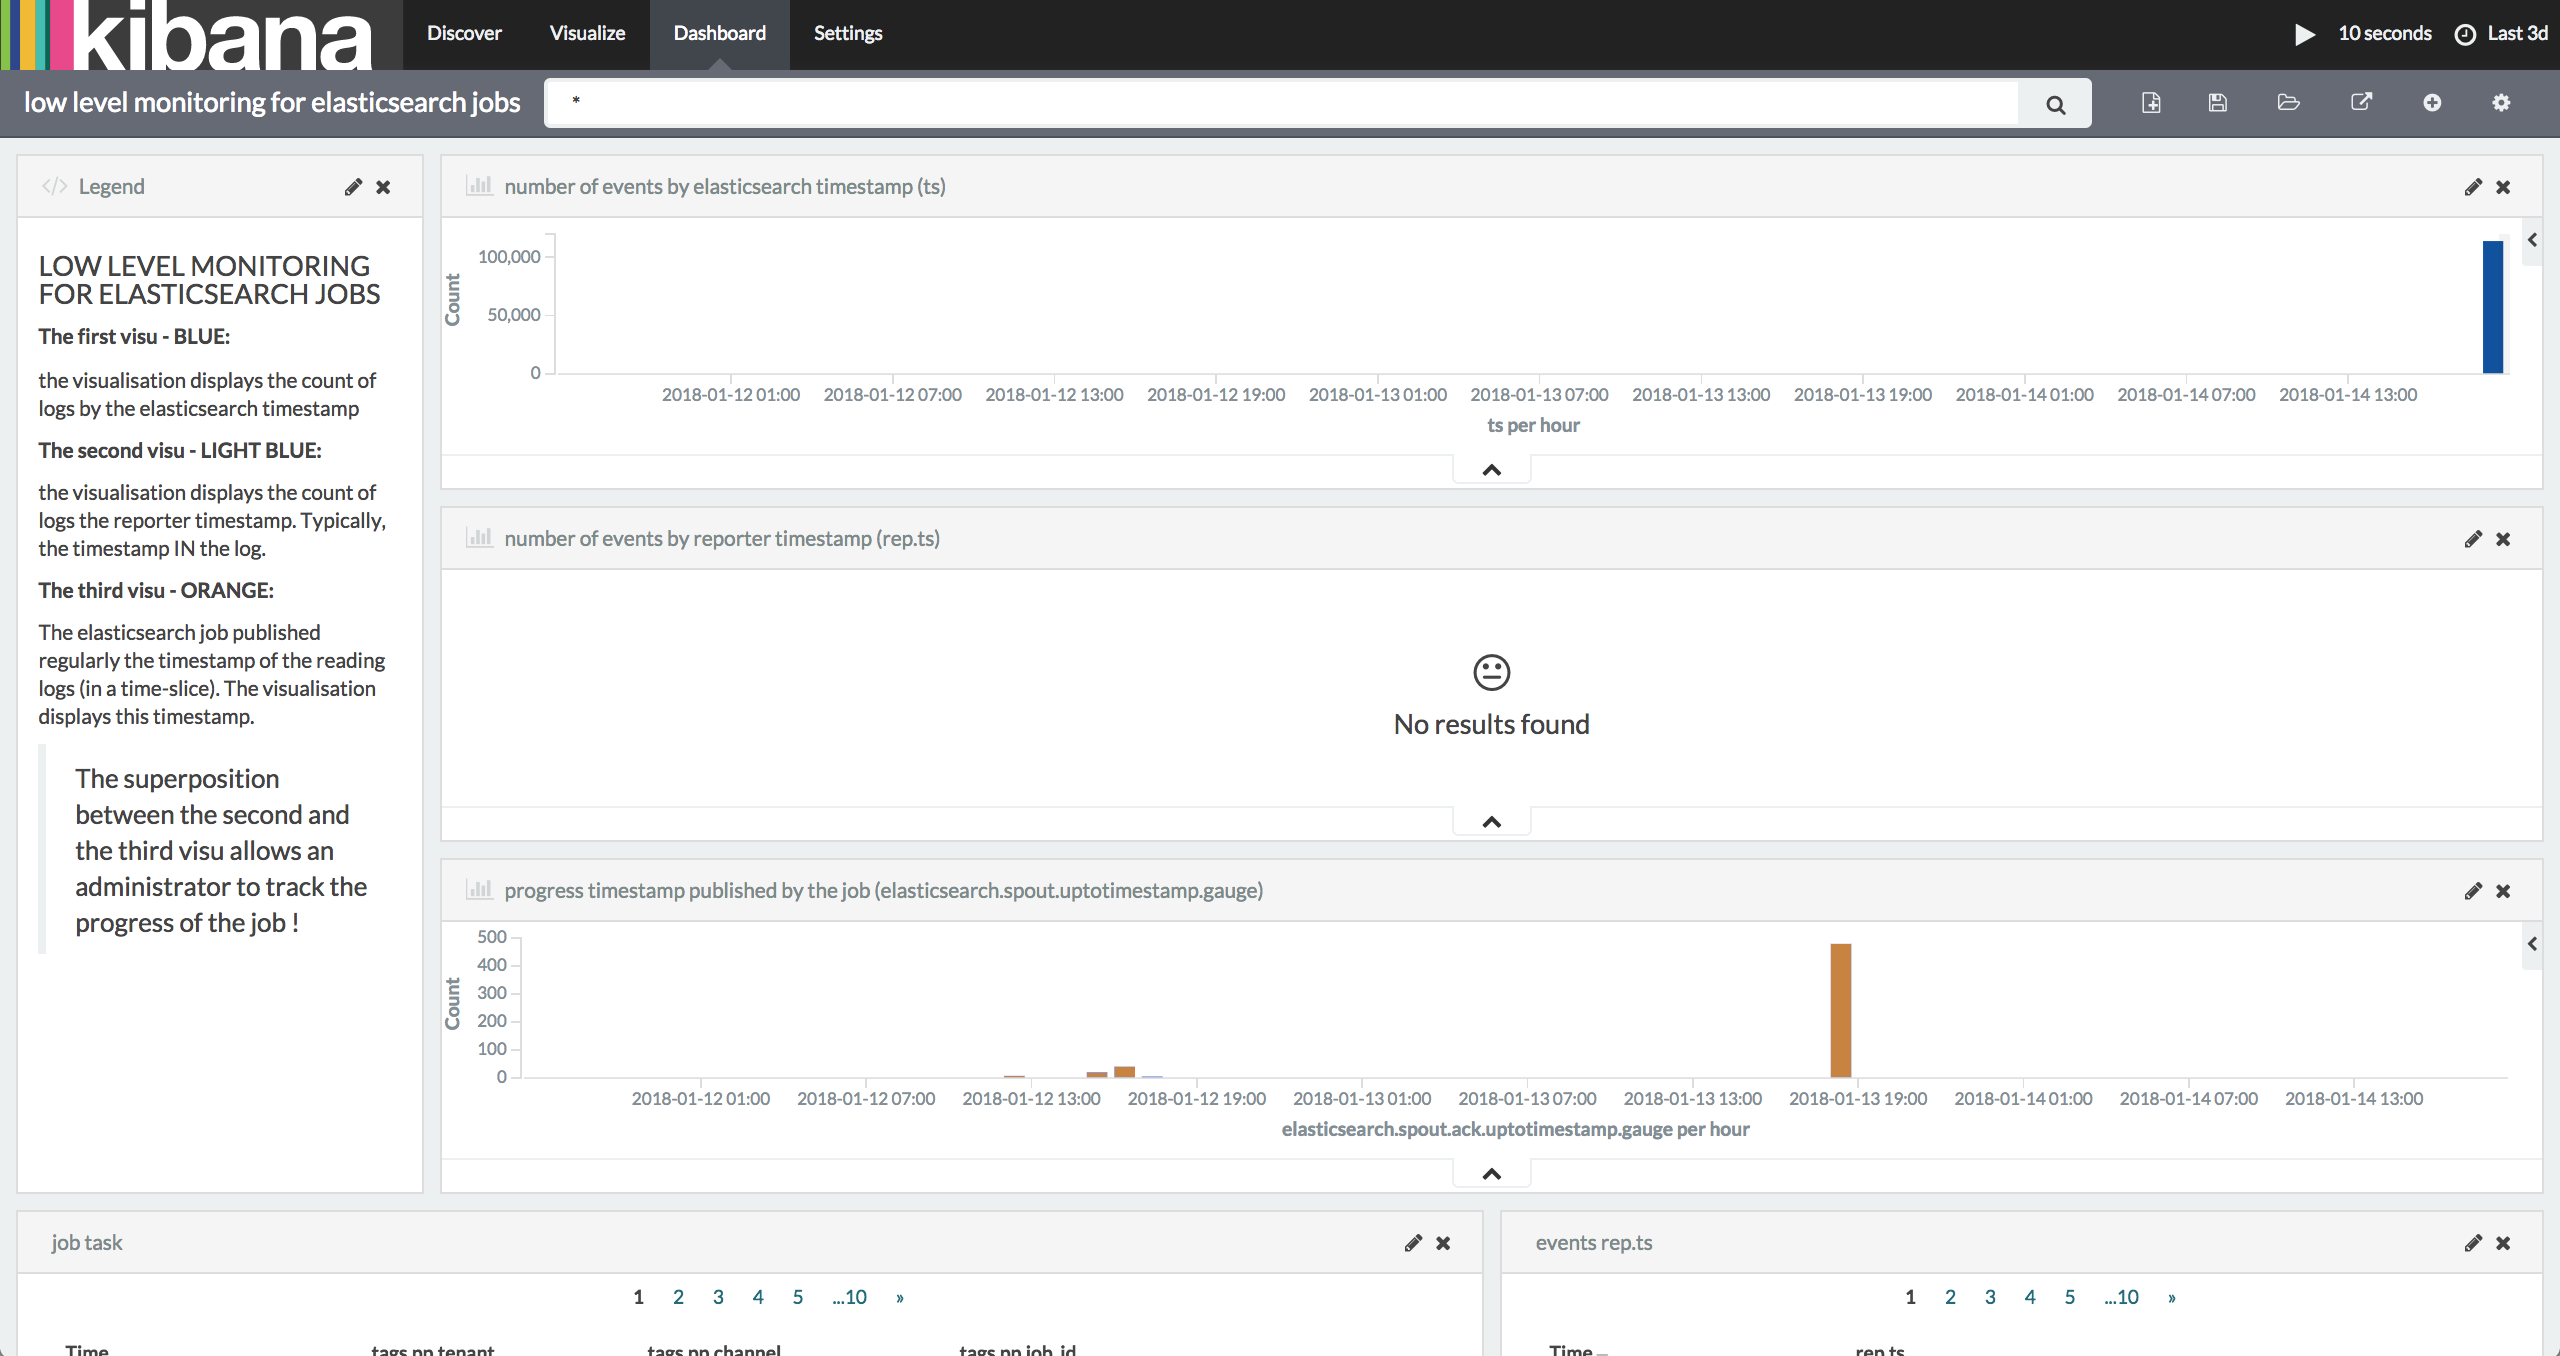
- Punchplatform provides metrics and dashboard components (elasticsearch&kibana)
- Create a dashboard to understand the processing in your job.
For example:
Before starting job:
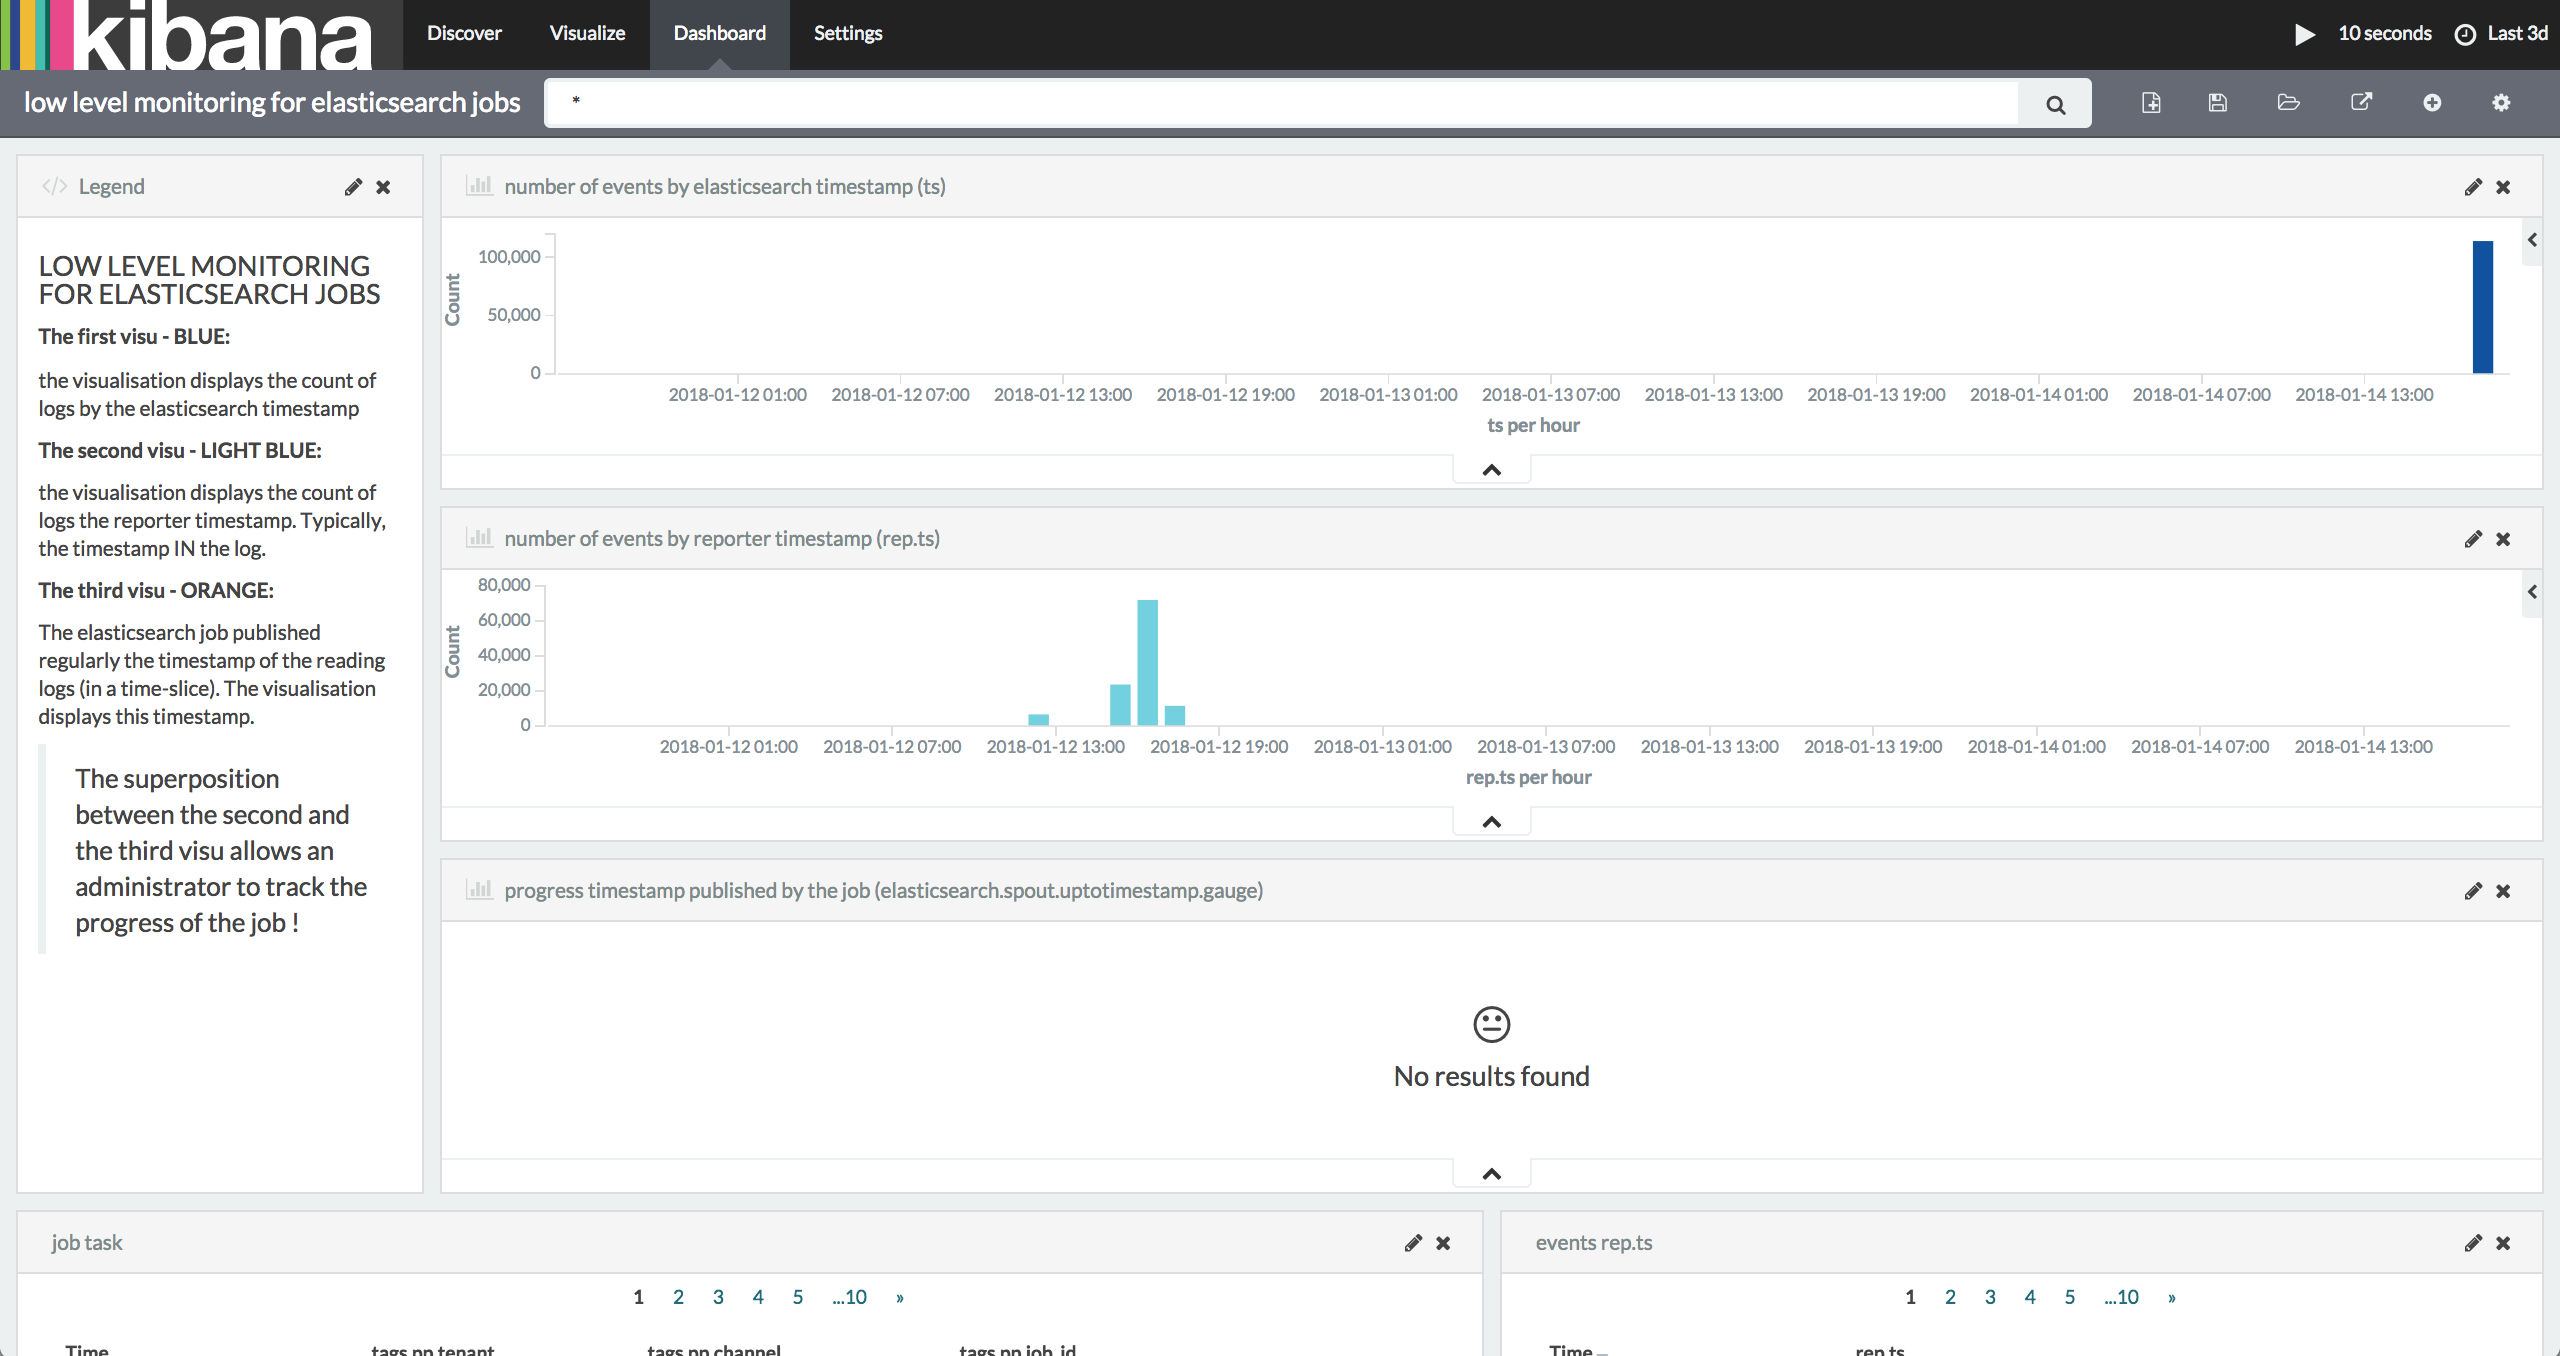
During the job:
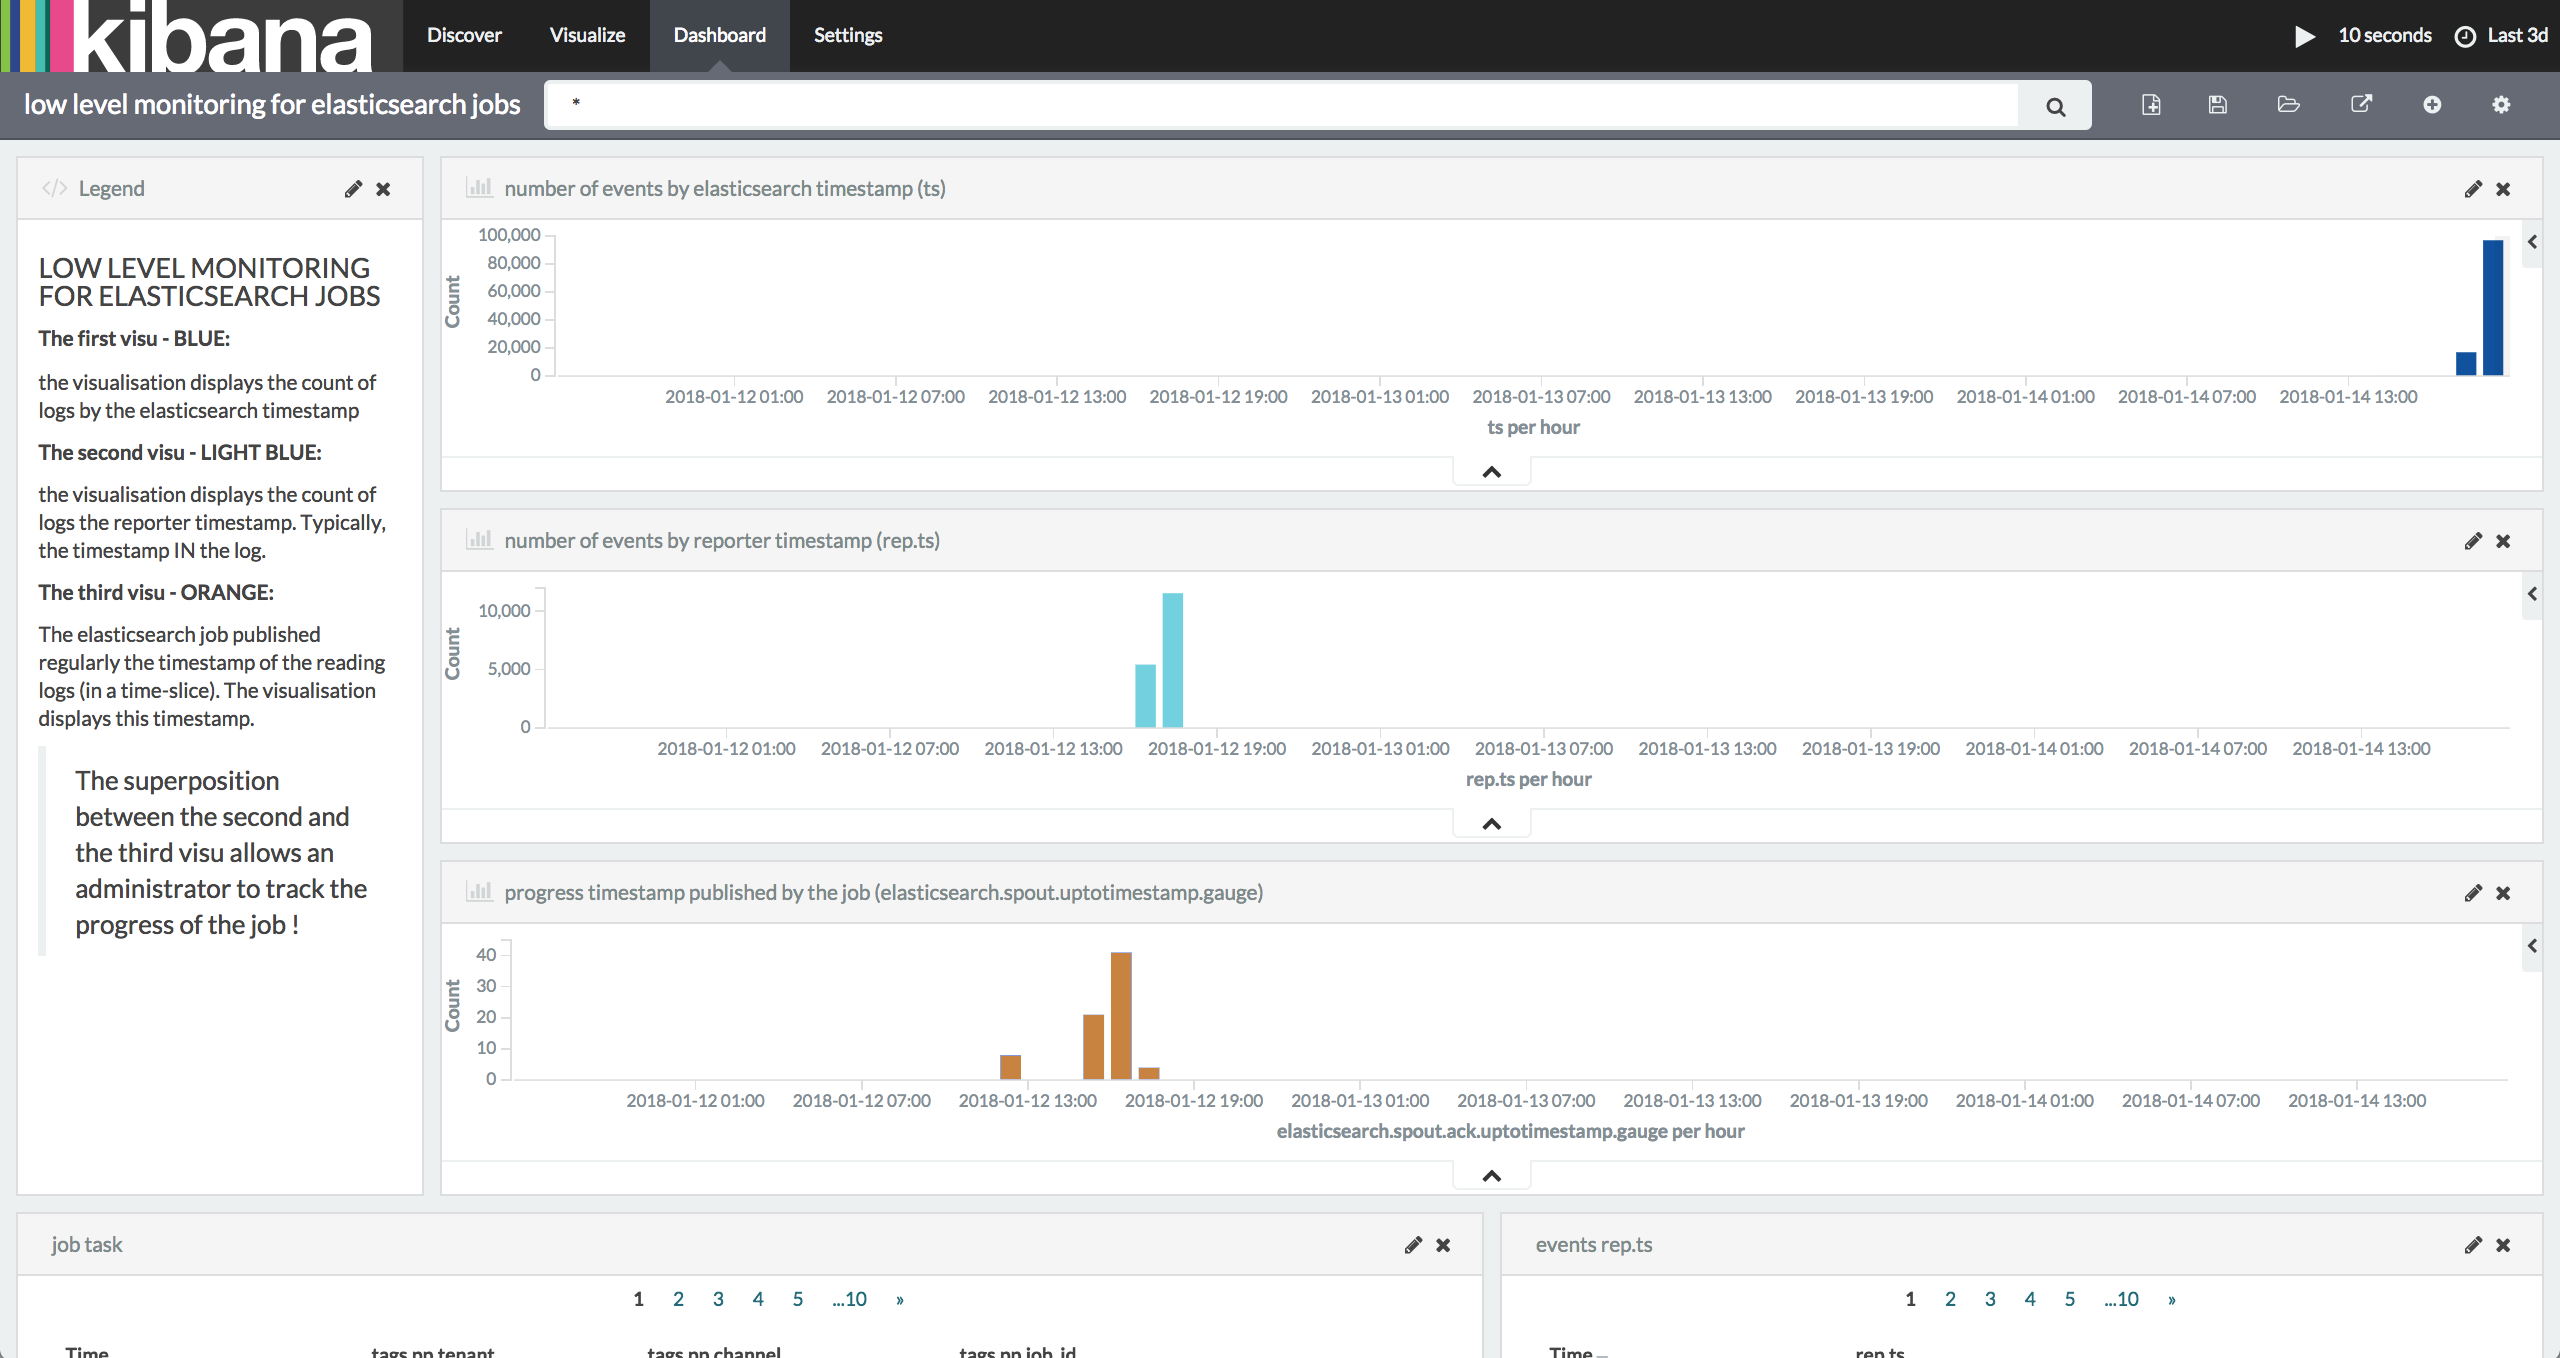
At the end of the job: