PunchPlatform Plugin Overview
The plugin is a set of features developed by Punchplatform. Its goal is to search for additional Kibana features that are accessible and powerful.
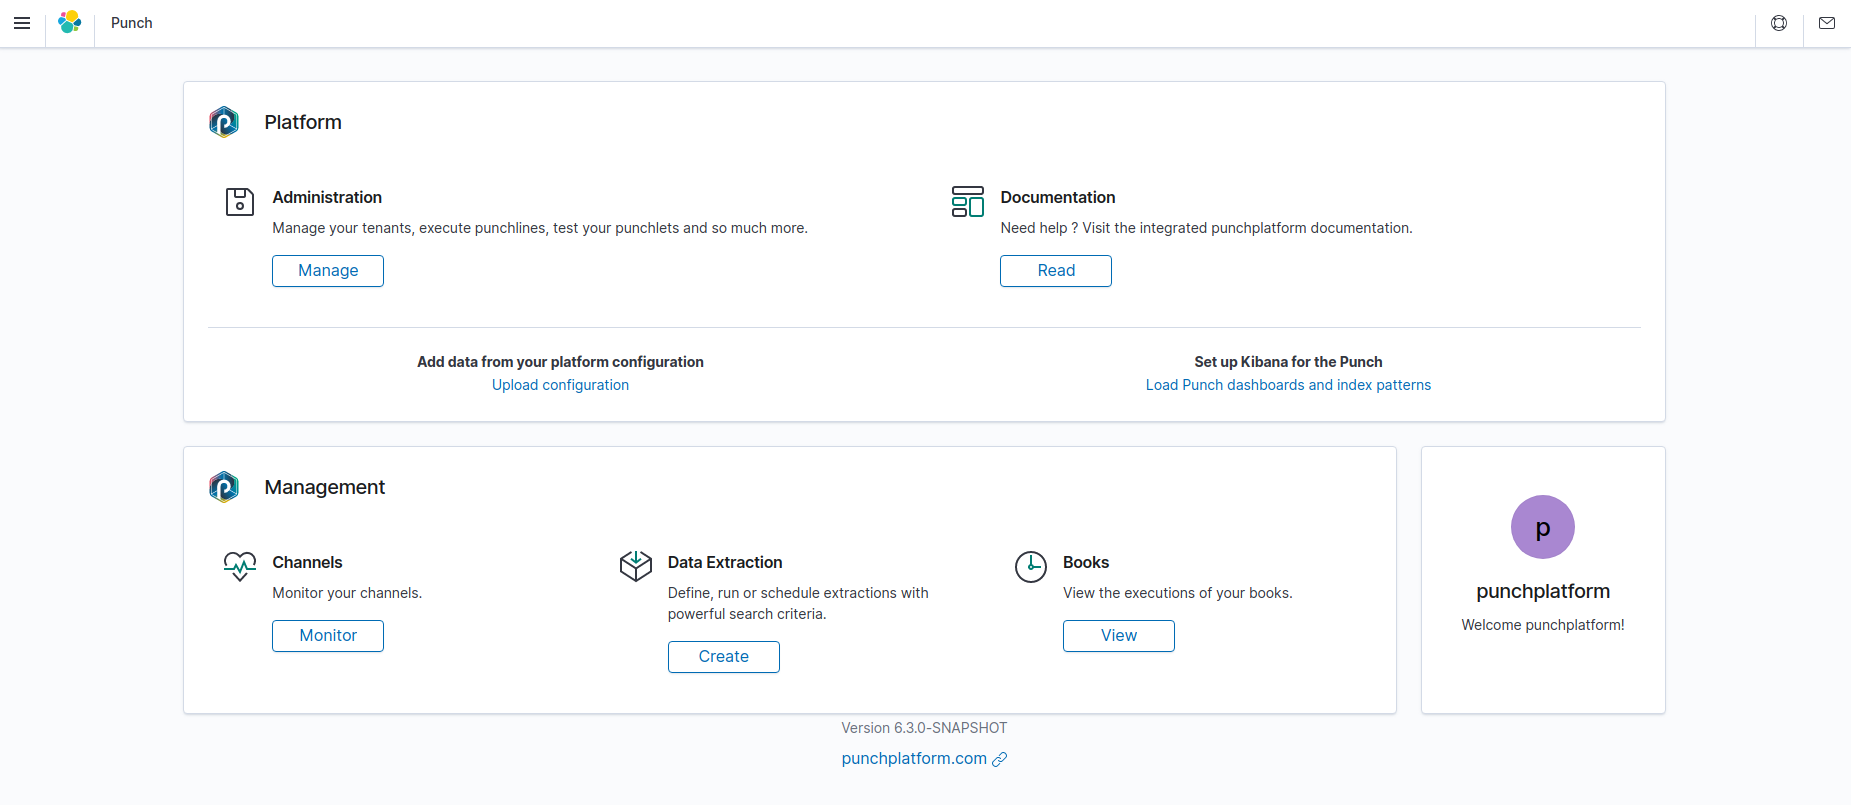
Here is a breakdown of the features of the kibana Punchplatform plugin:
- Administration: View and edit your resources ; test punchlets and execute punchlines.
- Documentation: Need help? Check the Punchplatform documentation without leaving Kibana!
- Channels: View the status of your channels, start and stop them
- Data extraction: Easily execute data extractions. Use it to create subsets of data to display in Kibana or export as CSV or JSON.
- Books: View the executions and create books such as replays
Info
Requirement:
You MUST have deployed the Punchplatform Gateway to enjoy the Punch UI plugin on Kibana. Follow the deployment instruction :
Administration
The Administration page gives you access to a resource manager, which is a remote storage space allowing you to store your various Punch resources, such as machine learning models, parsers or recording files. You can then access these resources using the REST API in your Punchline nodes.
Add a resource
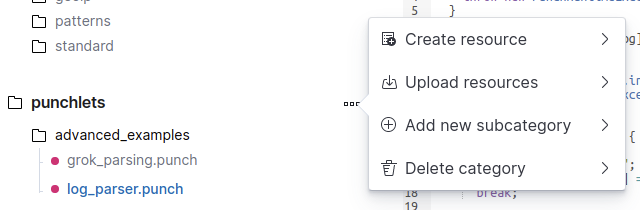
You can create a new resource by clicking on Create resource in the contextual menu of a category, or from the New resource button. You can also upload one or multiple local files by clicking on the Upload resource option.
Update a resource
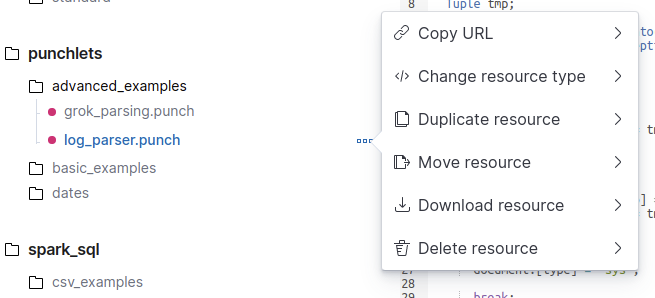
By clicking on the three dots icon next to a resource name, you can easily duplicate the resource, move it in another category, copy its URL, change its type, download or delete it.
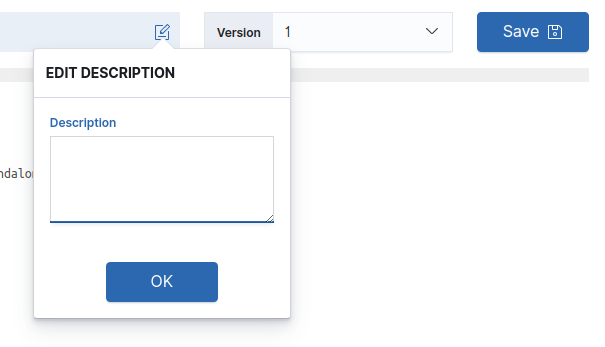
To add or edit the description of a resource, click on the edit icon next to the description as shown below. Enter the desired description and click OK ; the new content is shown in the description panel. To save the description, click on the Save button at the far right of the page.
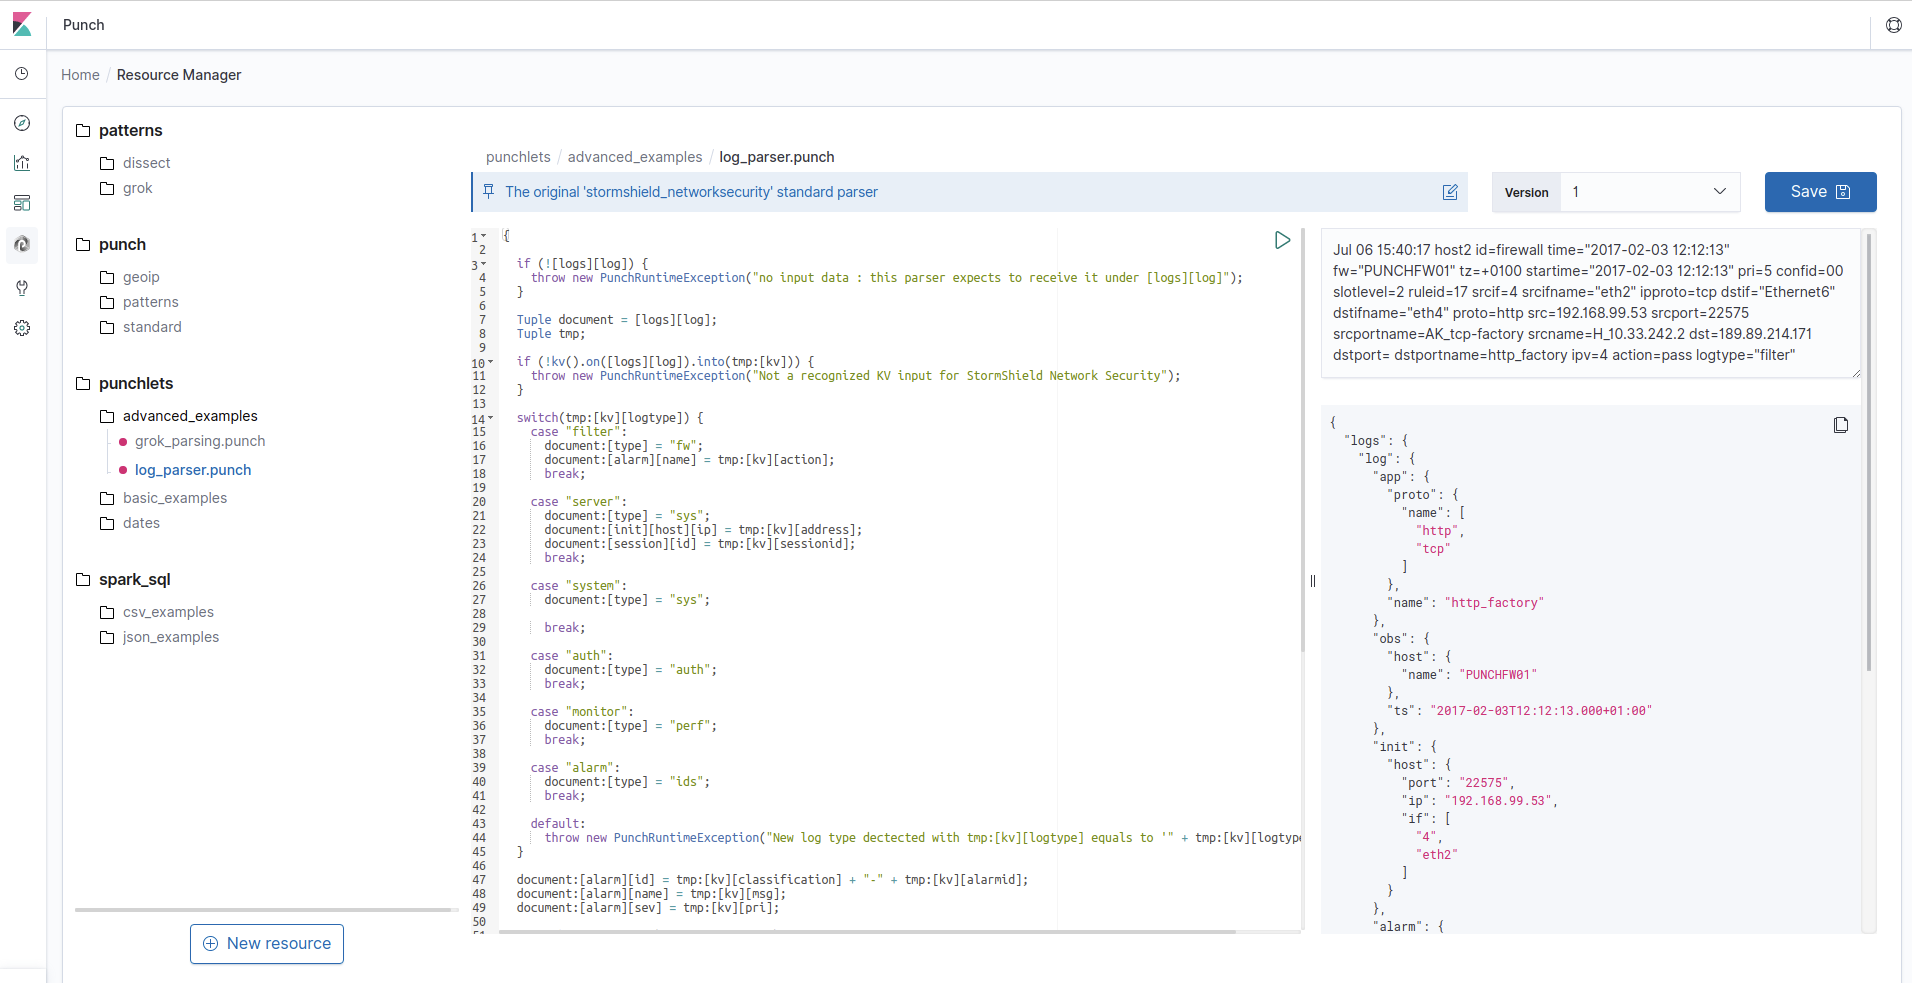
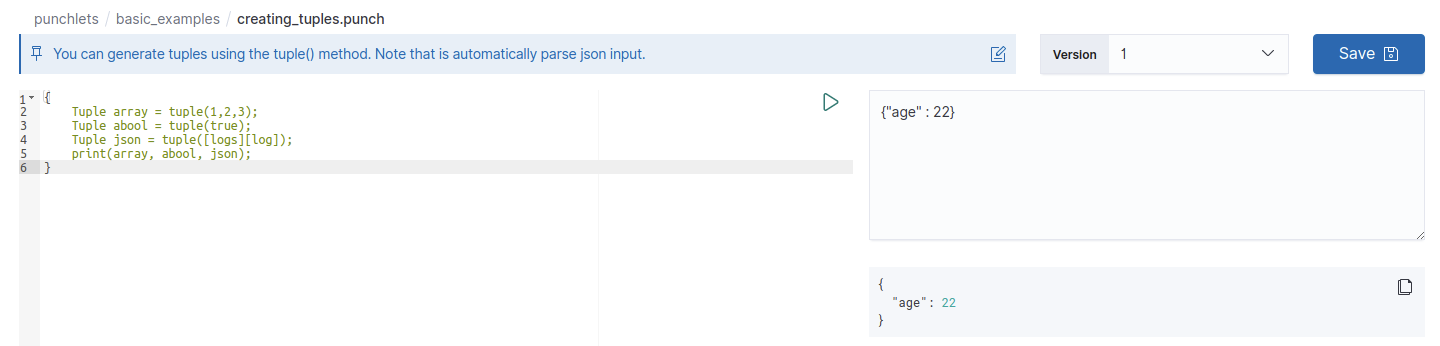
Edit .punch resources
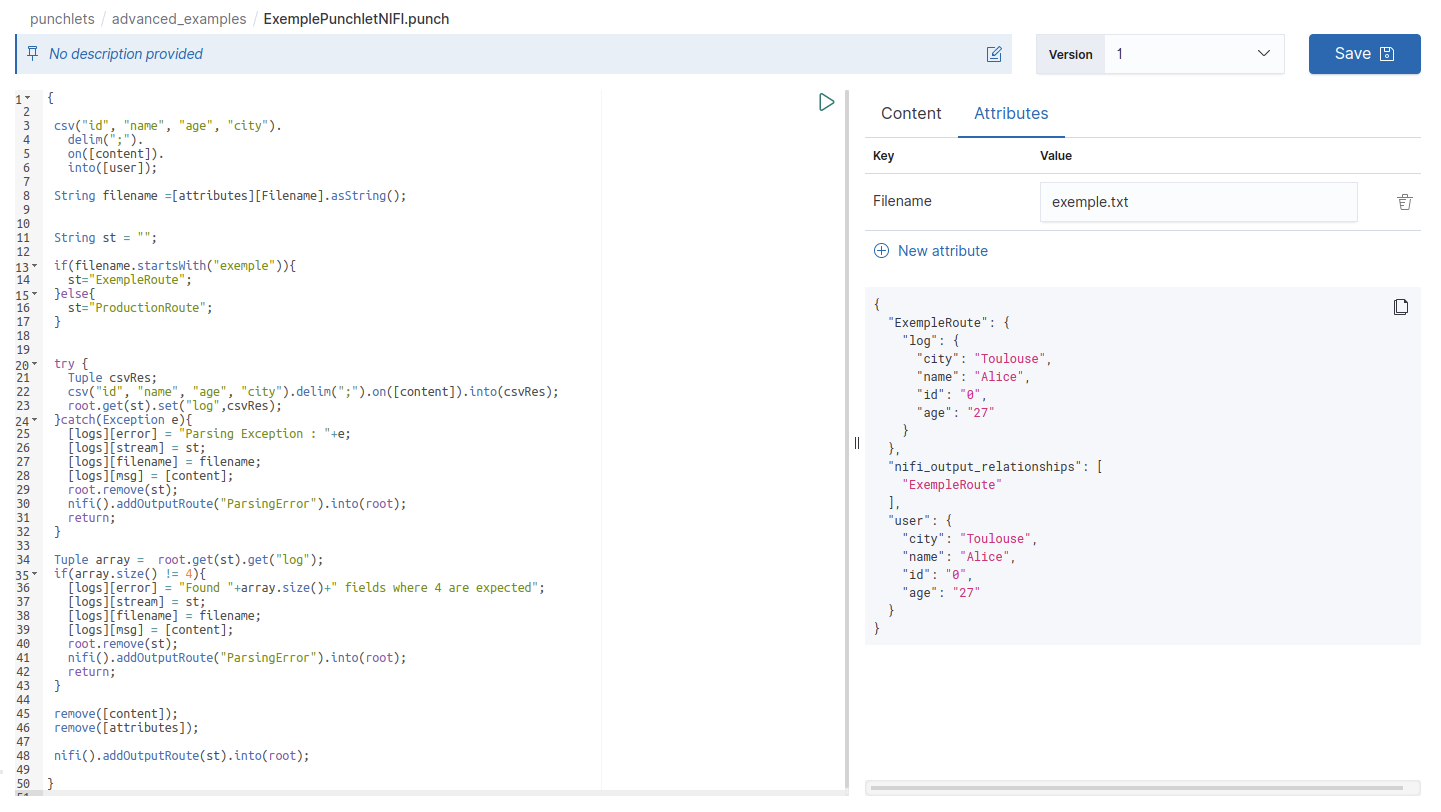
If your resource is a punchlet, you can test it by entering test data in the right input area and click on the green arrow button at the top right of the punchlet editor. The results will be displayed below the input area. Punchlet editors are slightly different depending on the kind of punchlet you're editing ; for example, if you're working on a Nifi punchlet as shown in the screenshot above, the input area lets you enter Nifi attributes in a table for better readability.
Note
To change the type of a resource, click on the three dots next to the resource name in the tree view > Change resource type > select the type you want.
The code editor understands the Punch language ; you can autocomplete method names or use snippets of code.
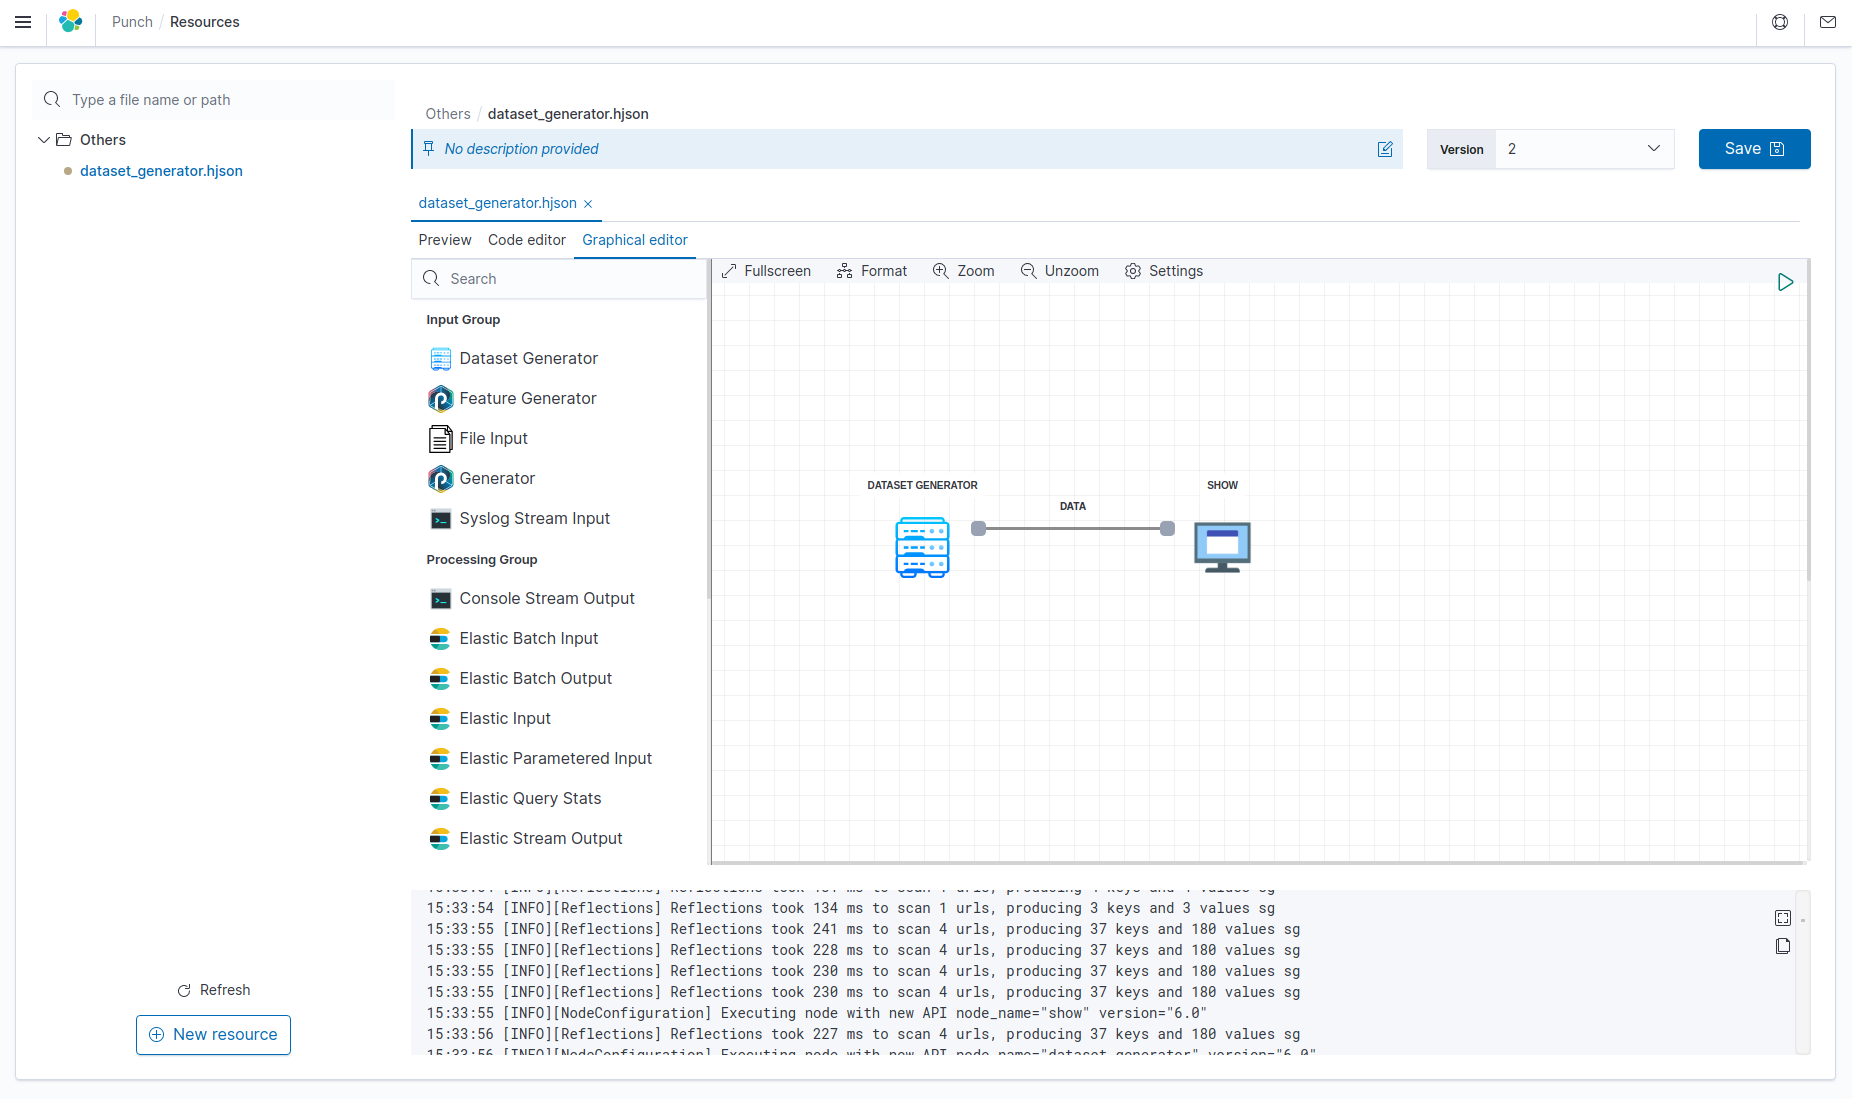
Visualize punchline resources
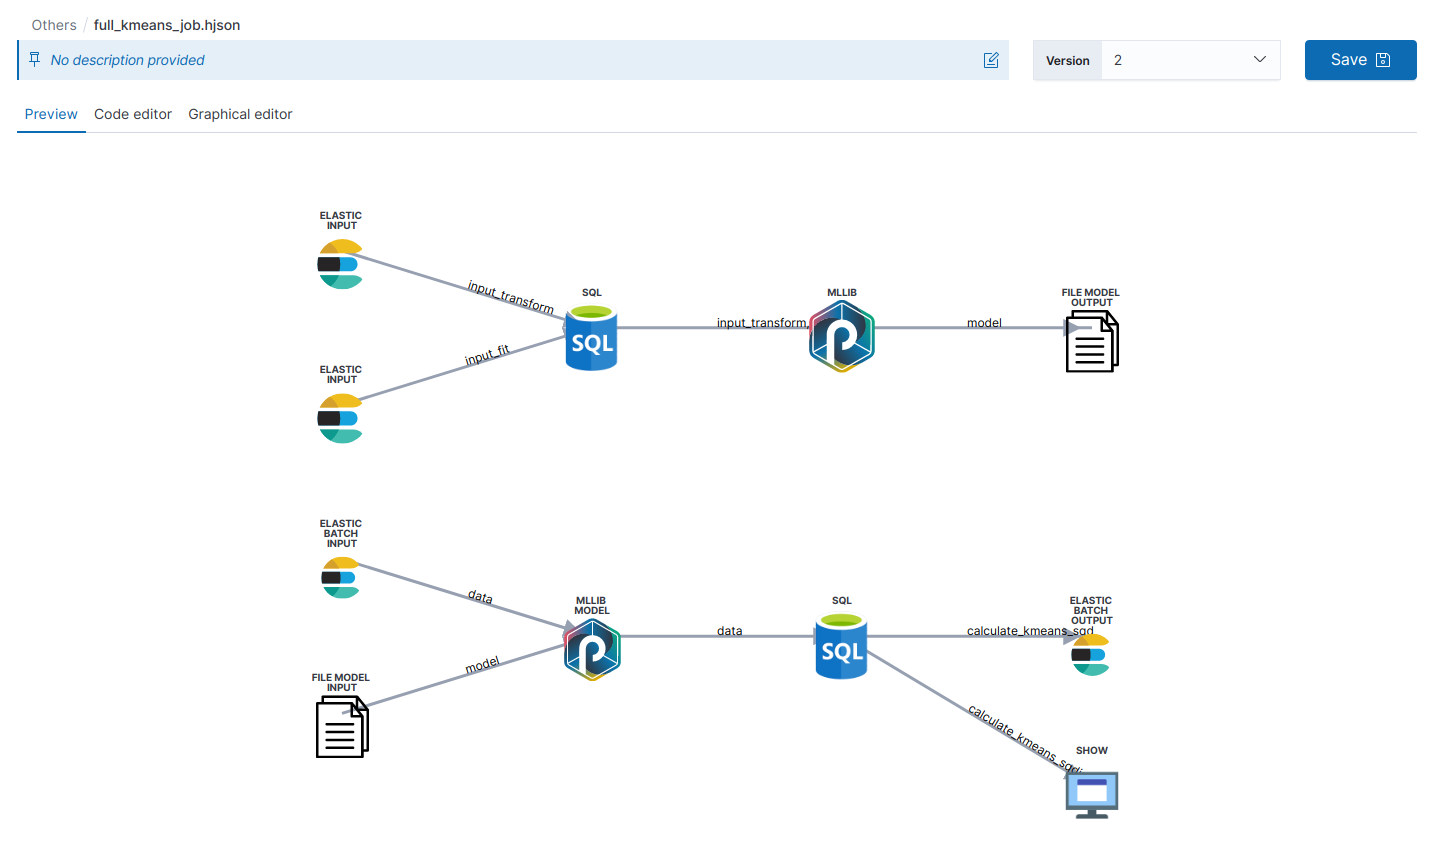
If your resource is a punchline, you can preview it as a graph. To do so, simply upload a .pml or .punchline file ; or if your punchline is within a JSON or HJSON file, upload it and change its type, as explained in the section above.
To edit the punchline, click on the "Graphical editor" tab and you will see an intuitive graphical interface. Use drag and drop to place nodes in a graph, connect and configure nodes, click on Execute. That's all.
Note
By default, the execution of a punchline has a 30-seconds timeout. To increase this limit, update the Gateway configuration to add the following section:
spring:
  mvc:
    async:
      request-timeout: <TIMEOUT_IN_MILLISECONDS>
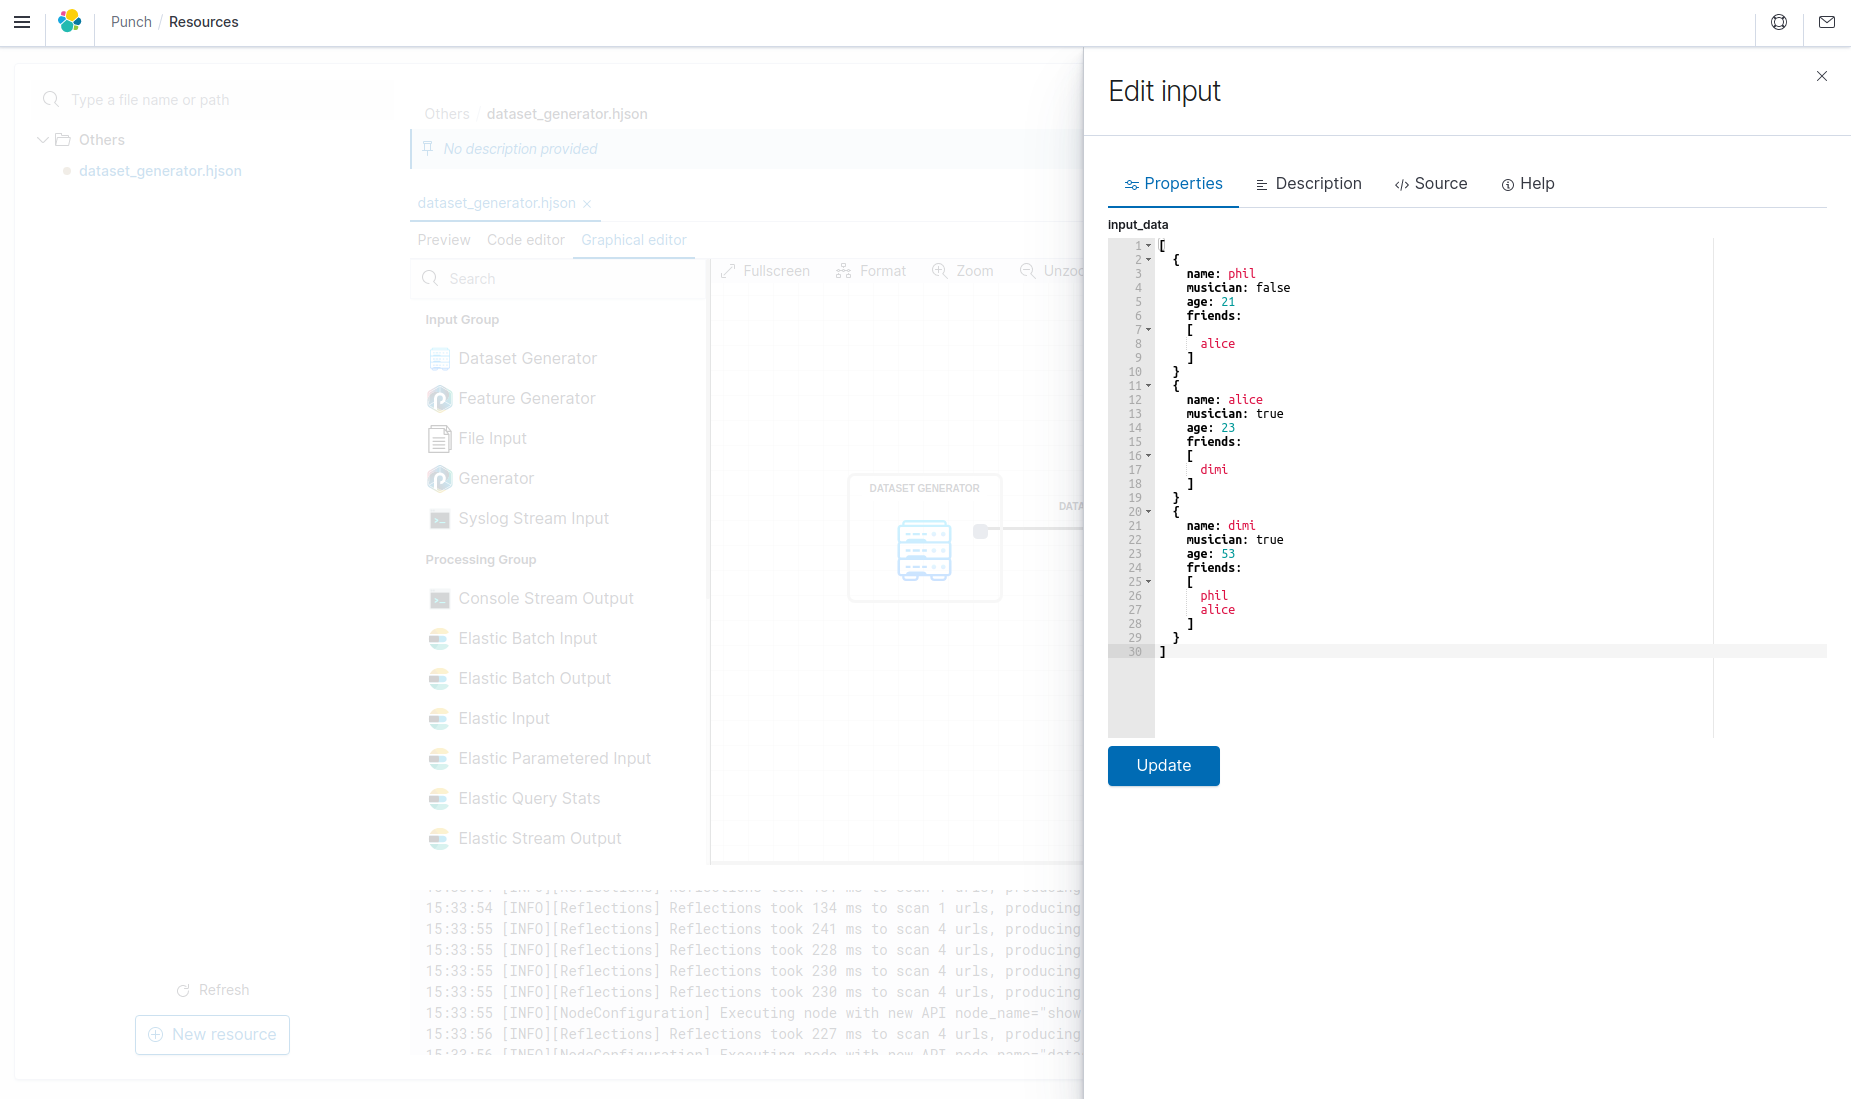
Create a Punchline graph
Drag a node on the left menu and drop it on the grid.
Put many nodes on the graph and connect. The links are automatically configured.
Double-click on the node to edit it, all field are automatically updated at the change. You can read help for configuring nodes in chapter Machine-Learning in this documentation.
Manage versions of a resource
You can edit the content of a resource with the code editor and save your modifications by clicking on the Save button. This will create a new version of the file, and you can switch versions using the Version dropdown at the left of the Save button.
Punch Tools
You can learn the Punch language or improve your skills using the Punch Tools, which are samples of punchlets, patterns or Spark SQL testers you can play with.
To access to the Punch Tools, you need to add the samples to the Resource Manager. To do so, go to the homepage the plugin and click on "Upload configuration".
You can also run the following script in the Punchplatform install directory :
punchplatform-populate-resource-manager.sh --samples
Then navigate to the Resource Manager in Kibana and you will see new folders like samples, which contains :
- patterns: Grok and Dissect patterns
- punchlets: basic and advanced examples of punchlets
- spark_sql: CSV and JSON examples of using Spark SQL
Channels
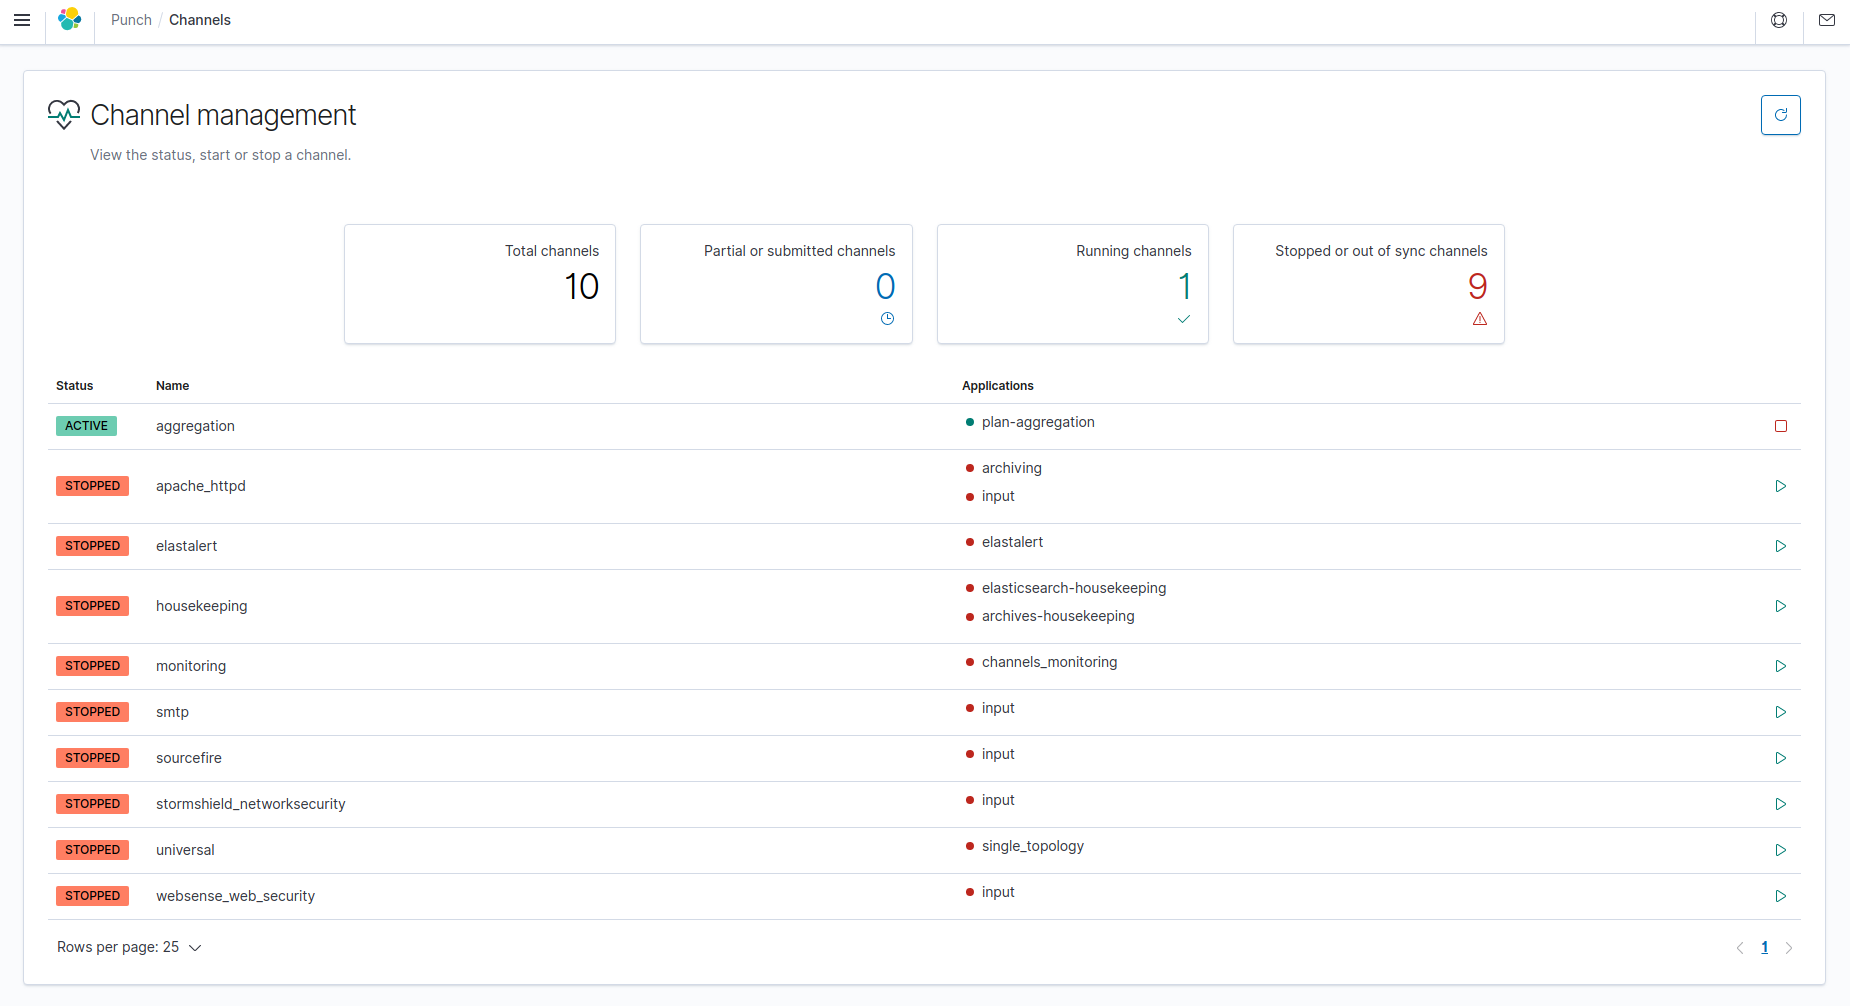
You can view the status of the channels available on your platform on the "Channels" page. A table displays all the channels with a "start" or "stop" button at the end of each row to start or stop the channel. To refresh the list of channels, click on the refresh button at the top right of the page.
Data extraction
Data extractions retrieve subsets of data. Using filters, you can filter data to be extracted and choose where to extract them.
Display extractions
Click on the Data extraction tile in the homepage. All extractions created
are displayed on this screen.
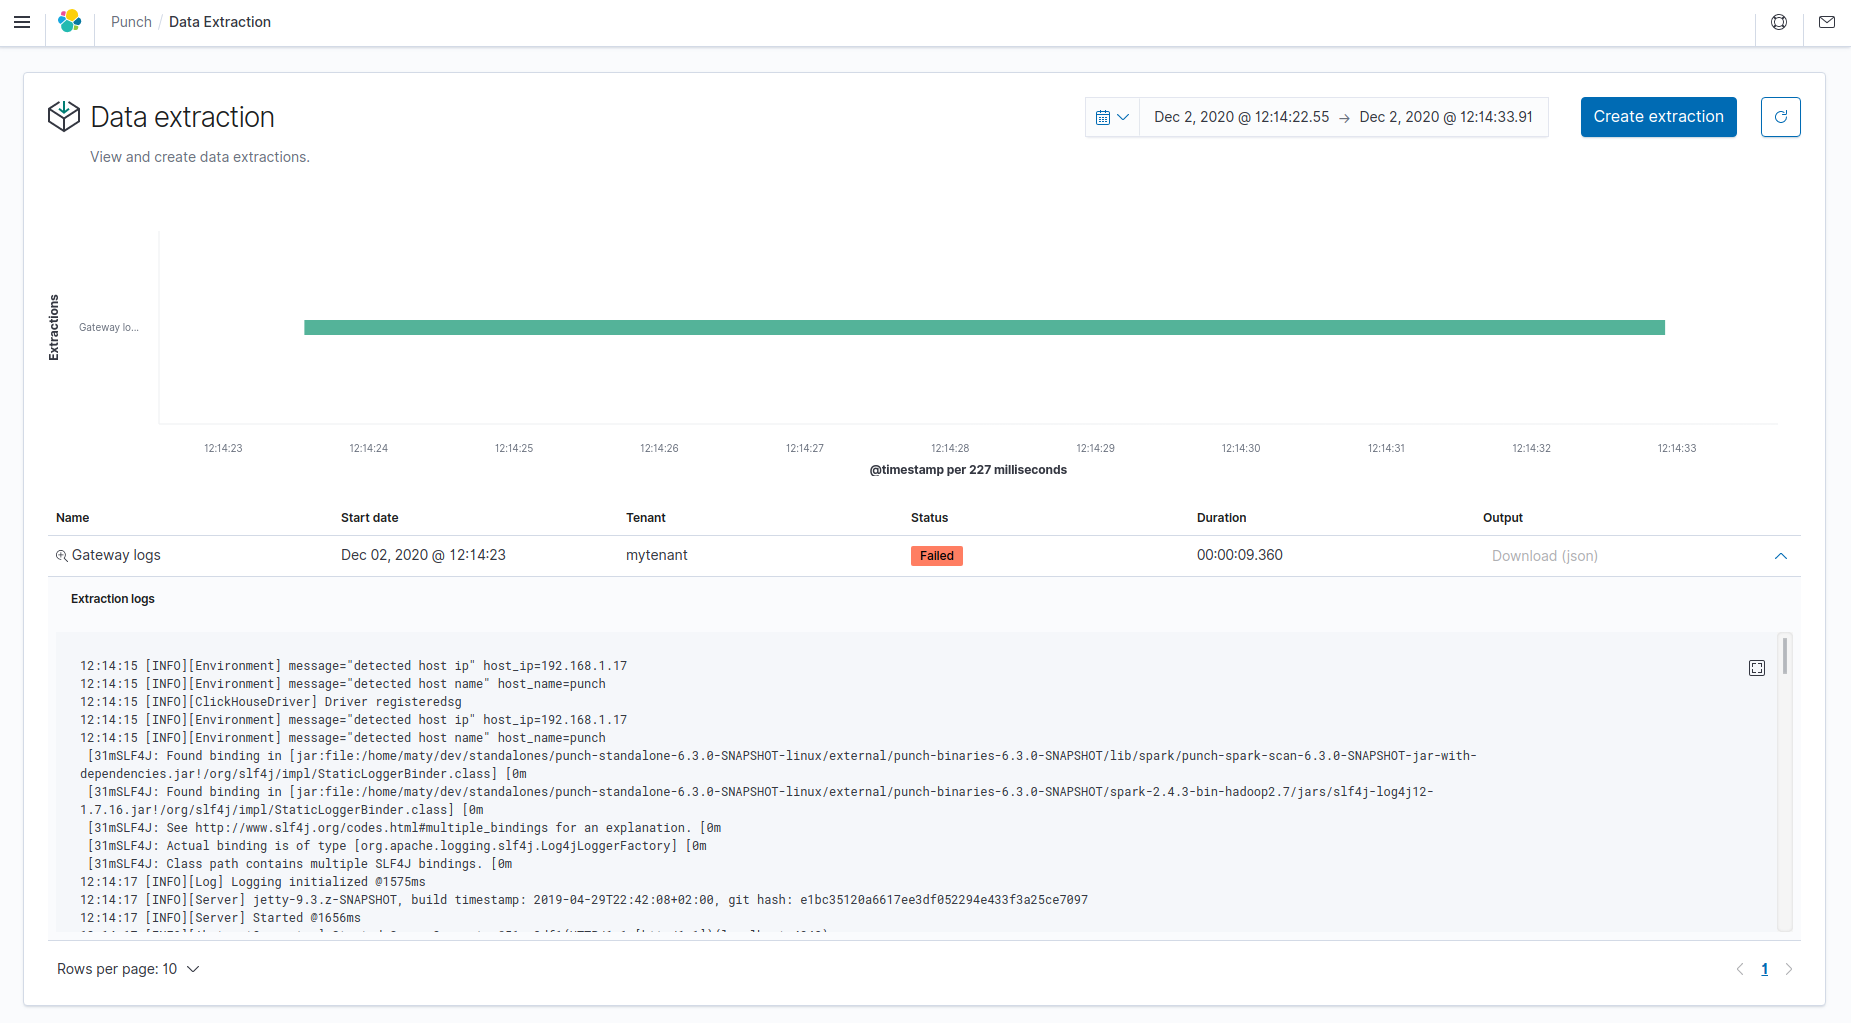
You can see extraction information like description, current status, duration and output location.
- Status: Available status are Scheduled, Submitted, Running, Success, Failed.
- Output: Extracted data location, if is in Elasticsearch, extracted data are in an new index pattern. Add it in Kibana settings to search it. If output is a file, you can download file directly. It will be an archive containing multiple files (in CSV or NDJSON).
- Logs: Click on the arrow at the far right of each extraction to toggle the display of its logs.
A timeline displays all the extractions available in the current time range, which can be changed in the time picker at the top of the screen. To zoom on a specific extraction in the timeline, click on the magnifying glass icon next to the extraction name. To see the output of an extraction, click on the arrow at the far right of the extraction in the table.
You can manually refresh the extractions by clicking on the refresh button at the top right corner of the page.
Create an extraction
Before you perform an extraction
- make sure :
- This Punch Plugin instance is connected to a Punch Gateway
- This Punch Gateway is connected to an ES data cluster
- The data you tend to extract are located inside this ES data cluster
- make sure you have added an index pattern in Kibana. If not, you can load Punch index patterns from the homepage by clicking on "Load Punch dashboards and index patterns".
- Save a kibana search from Discover tab.
To create a new extraction, click on Create extraction at the top of the page.
Fill in the fields
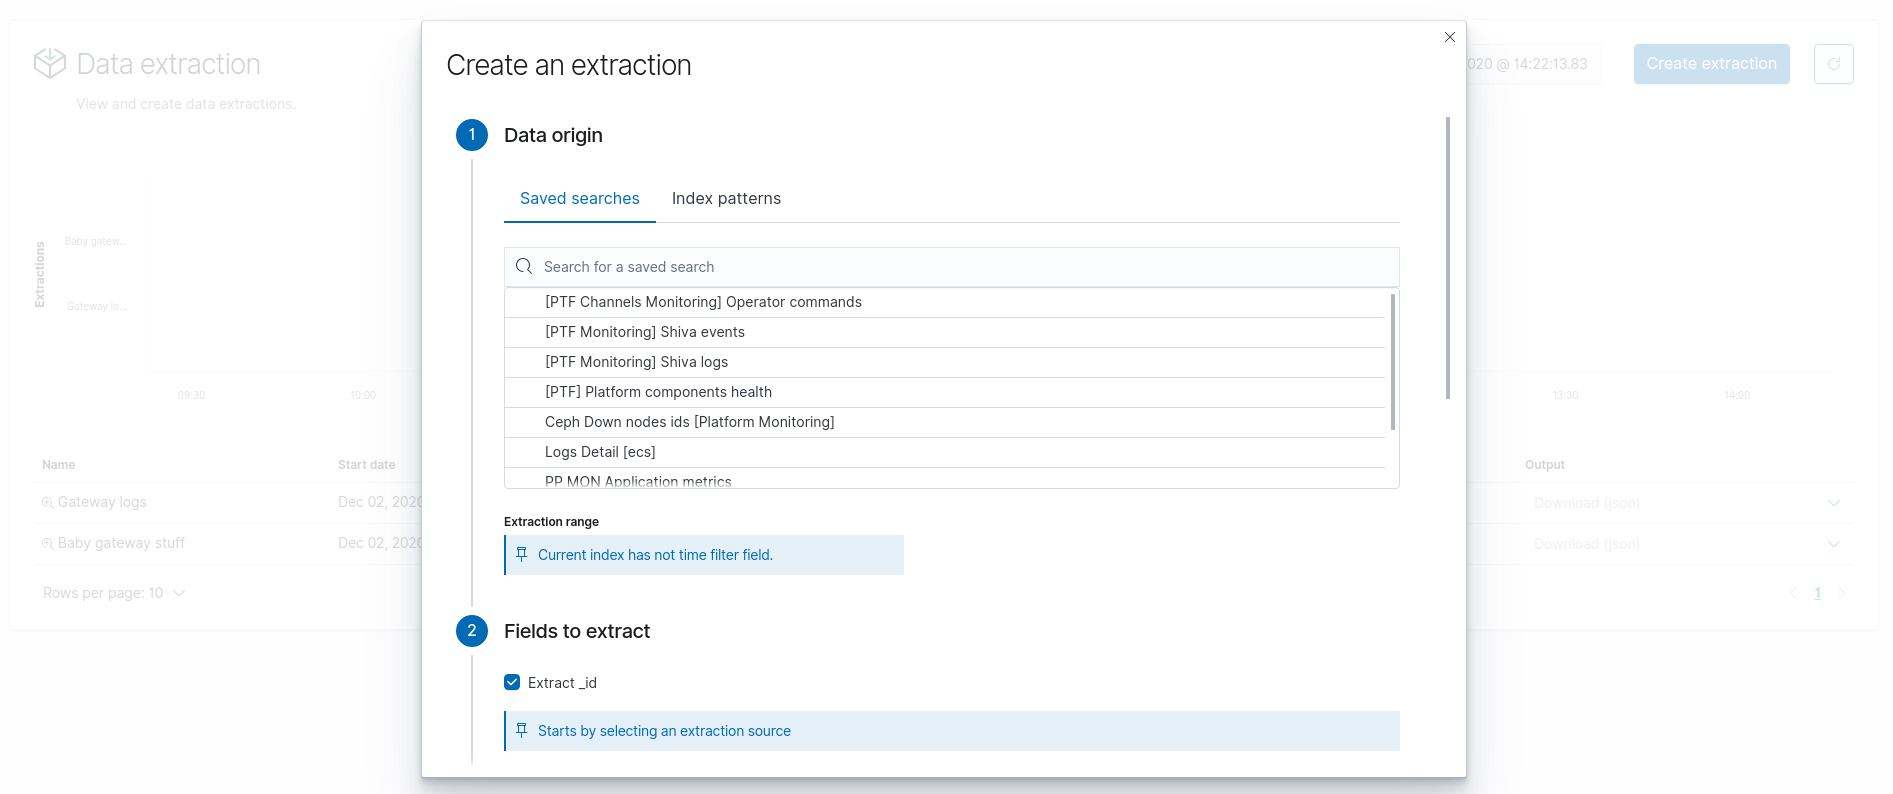
- Kibana saved search: Select from which save search (made from Discover) to extract the data
- Extraction range: Select date range
- Max size: Set maximum output rows
- Extract _id: Check to add a column
idwhich contains Elasticsearch document_id - Extract all fields: Check to add a column
sourcewhich contains Elasticsearch document_source - Fields to extract: Select fields you want in your subset. Click
on the field to put it into the other column. The available fields
are on the left, the selected fields are on the right.
TIPS: Use arrows between columns to move all from left to right and vice-versa. - Filters: Add filters on your extract data
- Description: Name your extraction
- Output format: Choose where to extract, in another Elasticsearch index, or in file (CSV/JSON)
- Separator: For CSV format. Choose separator to delimit your columns in output.
- Headers: For CSV format. Include column headers in output.
- Tenant: Choose in which tenant perform extraction
Advanced configuration
Runtime
Plugin Extraction is based on a Punch Topology. This topology can be run in Storm runtime (default) or in Spark runtime.
Plugin Extraction in Storm runtime is based on a Storm-like topology with : - Extraction Input - Punchlet Node to flatten tuples - File Output
Plugin Extraction in Spark runtime is based on a Spark-like topology with : - Elastic Input - File Output
To configure Plugin Extraction in Spark runtime, configure kibana.yml with :
punchplatform.extraction.useLegacy: true
Warning
Please note that Spark extraction requires data to fit in memory. If you want to extract massive amount of data, use Storm extraction instead.
Manual configuration
The topology to run extraction is based on a template. This template is filled with the information provided in the extraction form. You can modify this template to fine tune your extraction.
Storm template:
$PUNCHPLATFORM_GATEWAY_INSTALL_DIR/templates/extraction/storm/extraction_es_to_file.yaml.j2
Spark template:
$PUNCHPLATFORM_GATEWAY_INSTALL_DIR/templates/extraction/spark/extraction_es_to_file.yaml.j2
Books
Books are not enabled by default
In order to see the "Books" feature, you need to enable it by setting punchplatform.replay.enabled: true in your kibana.yml.
Display books
Click on the Books tile in the homepage. All replays created
are displayed on this screen.
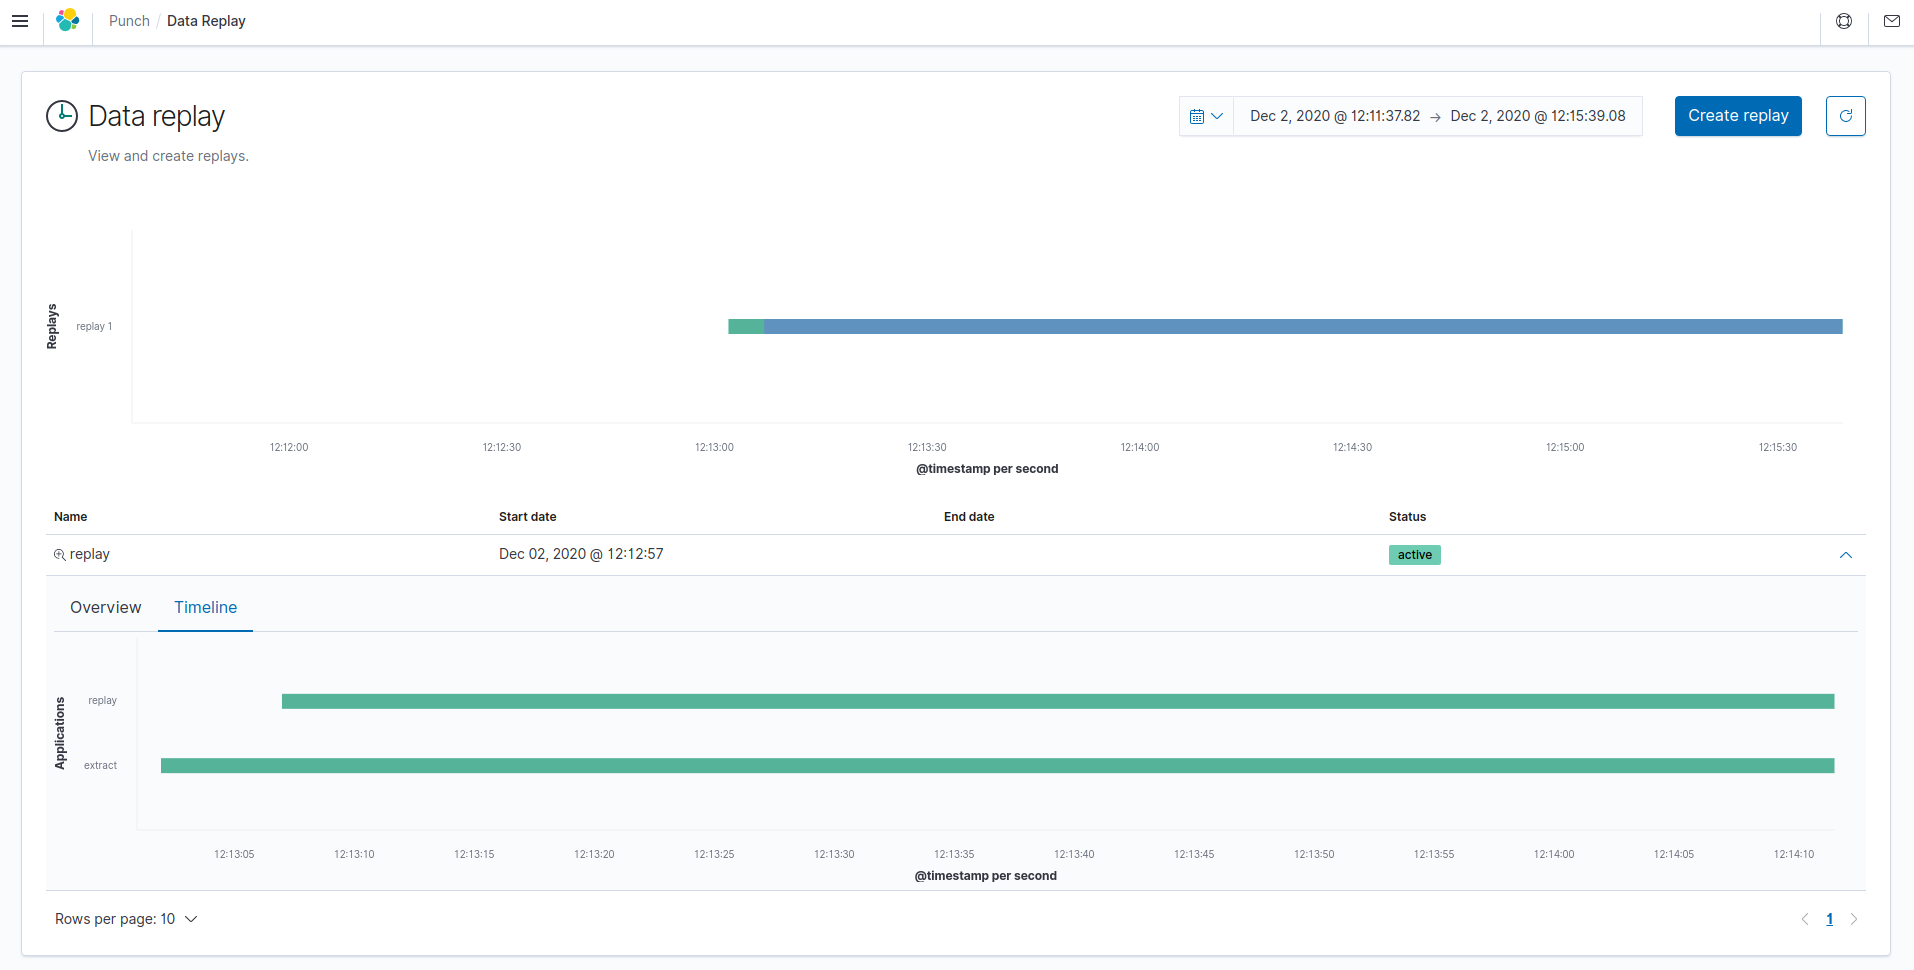
You can see a table displaying the books with their name, status, start and end dates. Click on the arrow at the far right of a book to toggle its details ; you will see two tabs,
Overview containing a graph view of the applications composing the book, and Timeline displaying the applications in a Gantt chart.
A timeline displays all the books available in the current time range, which can be changed in the time picker at the top of the screen. To zoom on a specific book in the timeline, click on the magnifying glass icon next to the book name.
You can manually refresh the books by clicking on the refresh button at the top right corner of the page.
Create a replay
To create a replay, which is a specific book, click on the Create replay button at the top of the page.
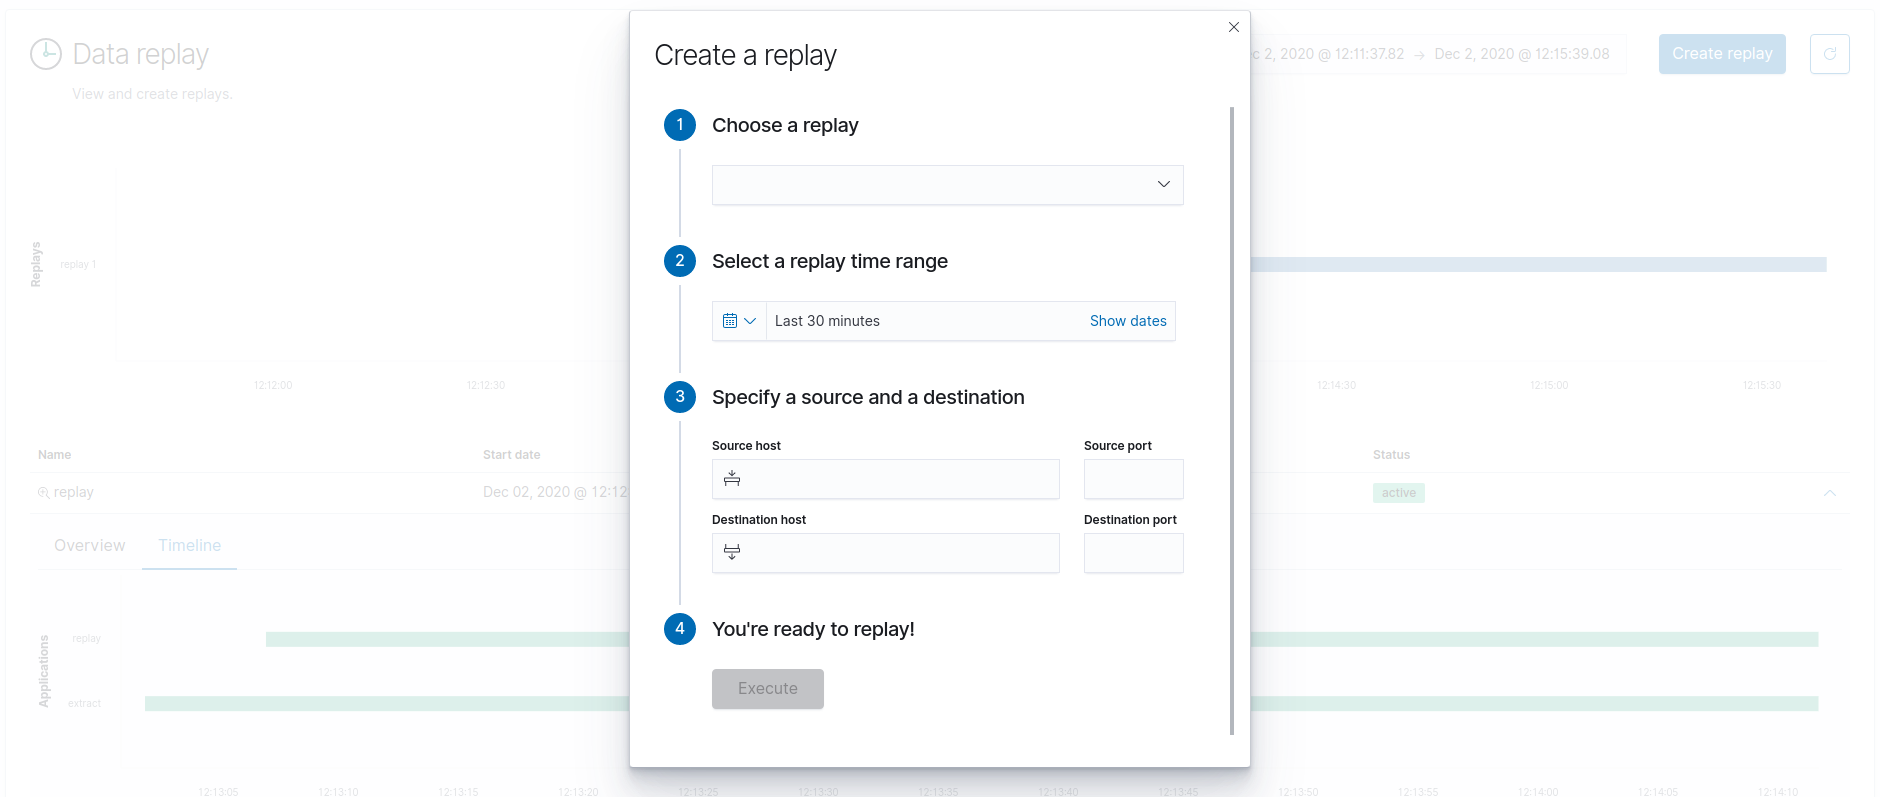
First, choose a replay from the dropdown. If you don't see any available replays, make sure you have a file marked as "Replay" in the Resource Manager.
How do I do that ?
- Go to the Resource Manager
- If the file of the replay you wish to use isn't available, upload it
- Change the resource type of the file and choose the
Replaytype
Then, select a replay time range and specify a source and a destination by typing their host and port. Once all the fields are filled, you can click Execute to perform the replay.
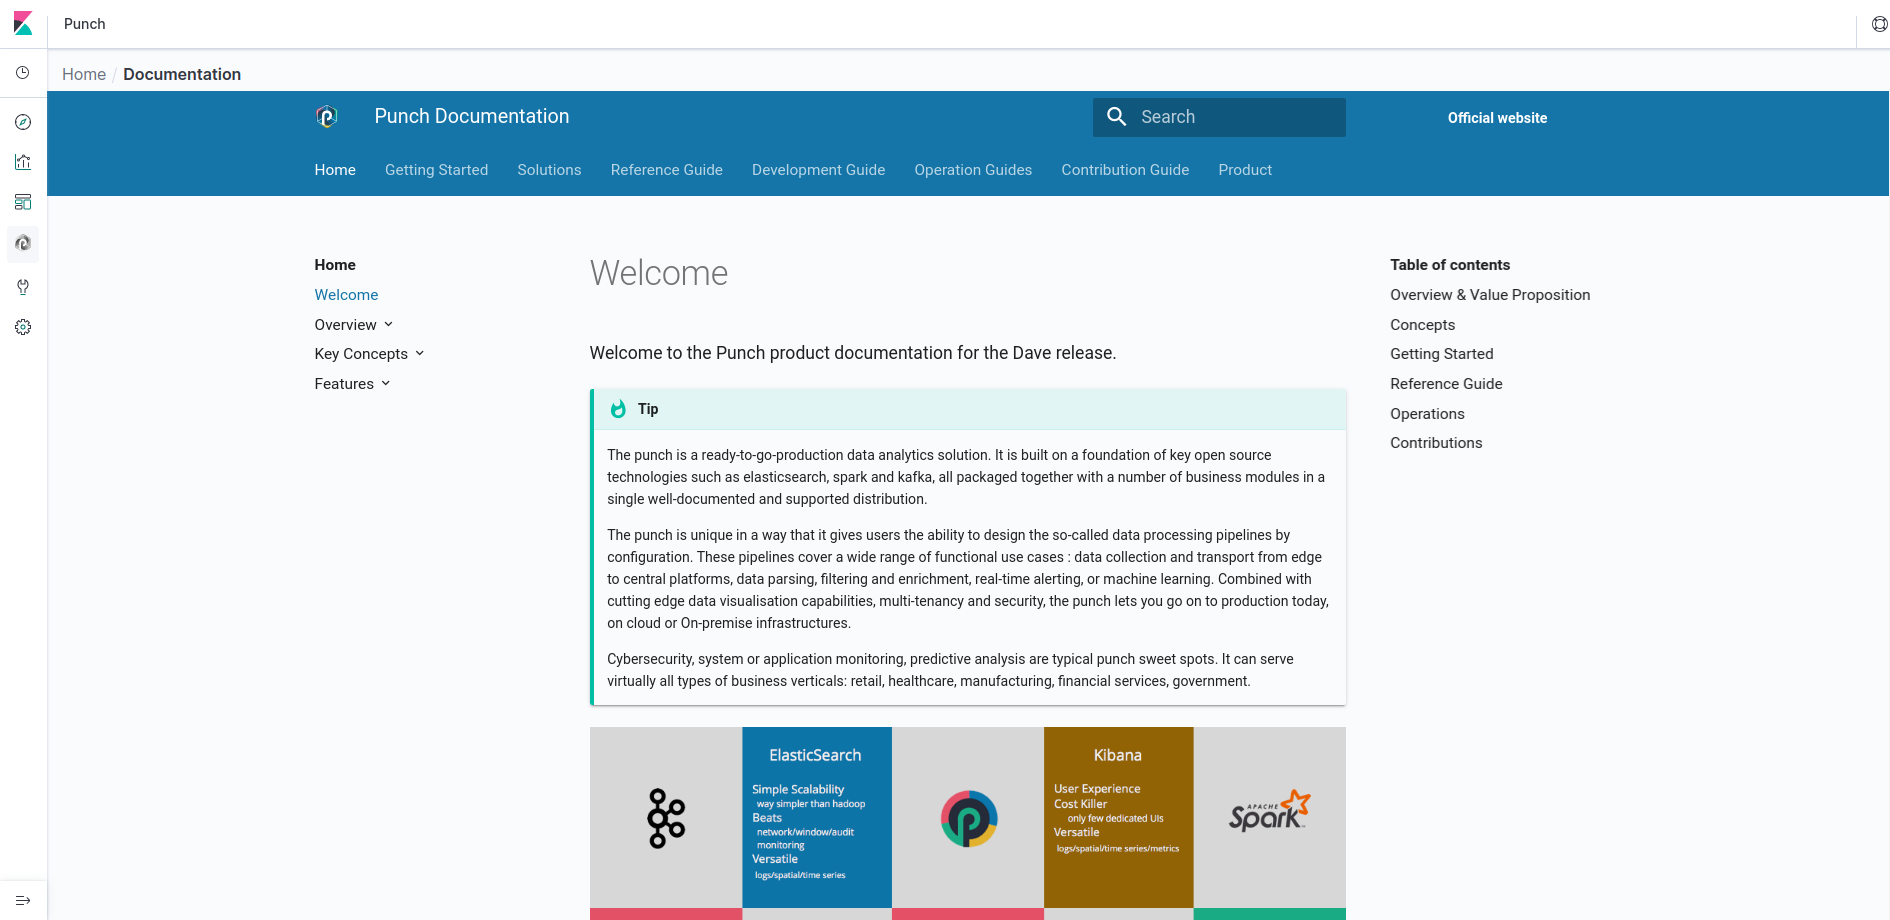
Documentation
Need help? Check the Punchplatform documentation without leaving kibana;