Components Administration Commands
Abstract
The punch tooling provides you with various means to check/troubleshoot the resources, services and processings at play, and to do basic operation actions related to the data lifecycle. This chapter provides an overview and index of these main commands.
Tips
- Do not hesitate using also the search toolbar of the punch documentation on more advanced or less frequently used topics. The best is to search for 'How To'.
- Similarly do not hesitate searching for punch pages directly on public search engines.
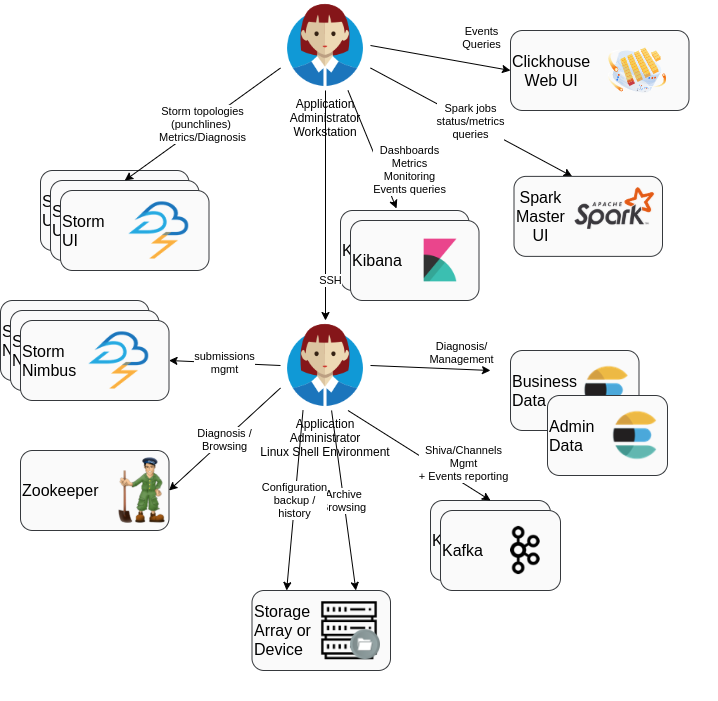
The operator can interact with the punch framework components either through command-line, or through web interfaces:
The PunchPlatform tooling is composed of :
- standard tools coming from off the shelf software components (Zookeeper, Storm, Spark, Kafka, Ceph, etc..).
- additional command-line tools provided by the punch:
- wrappers for zookeeper/Kafka useful operation tools, to reduce needed command-line parameters.
channelctlfor configuring and managing yourchannels(See Channels command)planctlandpunchlinectlto make it easier to launch test plans and punchlines (see man pages).- standard services that can be used for housekeeping/purge data, and to compute synthetic health
- standard punchplatform Kibana dashboards for viewing health/monitoring/events of the platform framework
- Elasticsearch-centralized metrics for performance monitoring or capacity management of platform resources and business application
Zookeeper tools
Health/status "4 letters" commands
These are inbuilt remote-invoked commands to quickly check status of zookeeper nodes and cluster.
See HOW TO Check or troubleshoot zookeeper cluster and servers status.
punchplatform-zookeeper-console.sh
This is a wrapper for standard zookeeper-console.sh tool, which is the standard tool
provided by Zookeeper to connect/browse/change data inside the zookeeper cluster.
It can be run from a Punch operator command-line environment.
Invoking this command without arguments when only one cluster is defined in the platform deployment will connect you to the cluster (unless it is unreachable, or down because more than half the nodes are down).
Tip
If there are several zookeeper clusters defined in the platform deployment, then
a cluster id has to be specified using the --cluster <clusterId> parameter.
Samples of useful commands once connected are :
ls \<path\>to list path (starting at /)
get \<path\>to view to data of a node (e.g. :get /punchplatformprod/kafka-back/brokers/ids/0)
See its man page or builtin help for details on commands.
zookeeper-console.sh
This is the standard tool provided by Zookeeper to connect/browse/change data inside zookeeper cluster. It is installed in Zookeeper setup \'bin\' directory. It requires a Java environment (manually set PATH to point to /data/opt/java.../bin or type [source punchplatform-env.sh] in PunchPlatform command-line environment to use punchplatform environment variable and path.
When a local punch operator environment is available, prefer punchplatform-zookeeper-console.sh
Kafka operation tools
There are two main aspects of operating kafka:
-
Managing the topics (creation/deletion/retention configuration/health status querying)
-
Managing the "topic readers" (
consumer groups) persisted data (the offset where they will start reading again if/when they restart consuming a given topic.
punchplatform-kafka-topics.sh
This command is documented for completeness. A better alternative is to use the corresponding platformctl commands.
This is a wrapper for kafka-topics.sh to reduce amount of parameters to provide. It can be run from a punchplatform operator command-line environment.
See its man page for details on commands.
Samples of useful sub commands are :
-
--list for listing topics of a cluster (in typical deployment there may be multiple clusters, like
frontandback): punchplatform-kafka-topics.sh --kafkaCluster front --listTip
If there is only one cluster in your deployment, you do not need to specify the cluster.
-
--describe for listing topics partitions status AND CONFIG:
1
punchplatform-kafka-topics.sh --kafkaCluster front --describeThis is useful to check if a broker is down/if a partition is not replicated.
punchplatform-kafka-topics.sh --kafkaCluster front --describe --topic rose. bluecoat_sg_510_dmz
In this command output, the column (In Sync Replica) indicates the up-to-date replica which exist in the cluster. If there is only one number, the missing numbers (as compared to ) :
1
2
3
4
 kafka topic for kafka cluster 'front'...    Topic:rose.bluecoat_sg_510_dmz
 PartitionCount:2    ReplicationFactor:1 Configs:
     Topic: rose.bluecoat_sg_510_dmz Partition: 0    Leader: 2   Replicas: 2 Isr: 2
     Topic: rose.bluecoat_sg_510_dmz Partition: 1    Leader: 1   Replicas: 1 Isr: 1
To better understand the output, please refer to How to troubleshooting Kafka.
Note
If specific kafka configuration settings (see
--createand--alter) have been provided for a topic, these settings will be displayed at the end of the topic line (after the topic name). -
--create for creating a new empty topic, while defining its characteristics
Usually, topics are created for you, either at deployment time (for central topics needed for shiva management), or at channels first start time (see
resourcessection in channelschannel_structure.hjsonfile)When using this command, you have to provide:
-
--replication-factor <factor>parameter: This is the total number of nodes on which each partition of the topic will be stored (so usually, we use '2' as replication factor in production environments) -
--partitions <nbPartition>parameter: this is the maximum number of consumers that can cooperate while reading the topic. This is usually 1 for 'small flows' and more for big flows (several tens of thousands of documents per second) needing processing scalability. Note that it is possible to add partitions to already existing topics.
You can also provide additional settings, like:
- --config retention.ms=numberOfMs for allowing Kafka to automatically delete data older than that duration (in milliseconds)
- --config retention.bytes=numberOfBytes for allowing Kafka to automatically delete data in excess of that compressed size in each partition (in Bytes)
Please refer to kafka documentation for all topic configuration settings details
Tip
If you want to see what specific settings are currently set for an existing topic, issue the
--describecommand, and the specific settings are displayed at the end of each topic line.Note that when no specific config value is displayed, then the retention settings are the ones deployed in the brokers configuration (see deployment settings).
-
-
--alter to add partitions while a topic already exists and contains data.
This can be useful in order to allow increased concurrent processing of topic data by multiple consumers
- --add-config (and --delete-config) to override/update a topic configuration property (or remove them and go back to cluster brokers default property value.
This can be specifically useful if, for managing production incidents, you need to increase or reduce the retention duration and allowed disk size for a specific topic.
Example of this subcommand can be found in How to alter an existing topic.
- --offsets for displaying the amount and first/last offset of messages in each partition of a topic
This is NOT a standard command of the kafka kafka-topics.sh command.
This command is useful if you wonder how many messages are currently stored in a partition,
to check that your retention settings (see --create) are correctly applied.
punchplatform-kafka-consumers.sh
This is a wrapper for kafka-consumer-groups.sh to reduce the amount of parameters to provide.
It can be run from a punchplatform operator command-line environment.
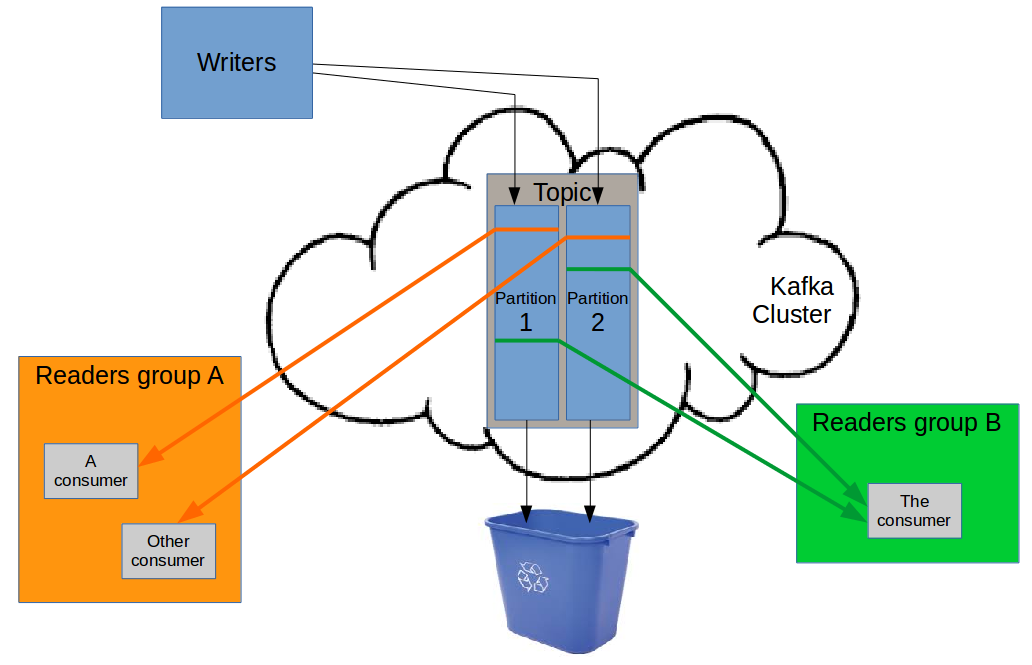
Kafka partitions contain part of the logs written to a kafka topic. This allows a different client kafka reader components (punchline kafka input nodes) to share the work of processing the message from a kafka queue.
Each partition can be read by only one consumer at a time, inside the cooperating consumer group.
Each time a consumer becomes alive or dead inside a consumer group, the group 'votes' again to distribute
as evenly as possible the responsibilities of handling the different partitions within the consumers group.
So if there are not enough partitions, some consumers in the group may have no responsibility, therefore not processing
any data from the topic. (See punchplatform-kafka-topics.sh --alter command to add additional partitions
if needed for increased balancing/scalability.)
Note that different consumer groups can work using the same input kafka topic but for different processing goals. In this case, because they are doing different things, they will not cooperate in any way (the same data will be processed independently by each consumer group).
A group of consumers is identified by a 'group name'.
In case some consumer client fails, each consumer will periodically store its current progress inside
kafka itself. This takes the form of a last known processed message offset for each partition in a topic, in
association to each separate consumer group. This information is stored inside a reserved __consumer_offsets kafka topic.
The punchplatform-kafka-consumers.sh command is aimed at
- reading this information, to know what has been processed or not of a topic messages, by a given consumers group.
- changing this persisted 'committed offsets' for a consumer group, so that upon restart
it will (re)start its processing from a different point in the message queue (for
replayorskippingpurpose).
It can be run from a punchplatform operator command-line environment.
Command help (both of the inbuilt kafka-consumer-groups.sh subcommands and of the additional punchplatform-kafka-consumers.sh subcommands)
can be obtained by invoking punchplatform-kafka-consumers.sh --help.
Important
For all subcommands of punchplatform-kafka-consumers.sh, a kafka cluster will have
to be provided if there are more than 1 in the platform deployment. E.g. :
punchplatform-kafka-topics.sh --kafkaCluster front --list
Samples of useful sub commands are :
-
--listto display all the names of consumer groups that have saved some last processed messages offset in kafka. -
--describe --group <groupName>to display for each topic partition-
The last persisted/committed 'processed' message offset. This is the point where the consumer will start reading/processing again, in case of consumer failure or restart. Note that the consumer may have already processed some later messages, because this offset is updated only periodically (around every 30s). So after a restart, some messages may be re-processed (this is
at least onceprocessing guarantee). -
The offset of the last message that has been written to this topic. This allows to determine how much
backlogthe consumer has (messages not known to be read/processed yet). -
The actual lag (backlog) of the consumer (messages not known to be read/processed yet).
Note
If you want to know the total amount of messages that are currently stored in a topic, i.e both the ones
not processedAND thealready processed, then you should usepunchplatform-kafka-topics.sh --offsetsubcommand. -
-
--reset-offsets --group <groupName>to change to (re)start point of a consumer groups when reading/processing a topic.This is very useful when you want to either re-process/replay some kafka topic data, or you want to skip some incorrect topic data, during an integration or test process.
This is a standard command of
kafka-consumer-groups.shthat requires many settings (invoke--helpfor details), including the very important--executeflag to actually do something.For this reason, shortcut subcommands are provided by the
punchplatform-kafka-consumers.shwrapper, to be used instead of the native--reset-offsets:--reset-to-earliest --group <groupName>: to change the committedrestart offsetso that ALL available messages in the queue are (re)processed at consumer start.--reset-to-lastest --group <groupName>: to change the committedrestart offsetso that ALL currently stored messages in the queue are skipped at consumer start.--shift-offsets <numberOfMessages> --group <groupName>: to forward or rewind so that the indicated number of messages are skipped (positive) or replayed (negative) at consumer start for each partition.
Important
- All these wrapper subcommands need that the consumer group punchlines have been stopped before the command is run.
- Some consumer groups may be used to read from multiple topics. All these subcommands will act on all the topics consumed by the consumer group.
If this is not the desired action, then please refer to the
--helpin order to use the--reset-offsetsmore general native subcommand.
kafka partition reassignment tool
This tool can be used to change the amount or location of a topic partitions replicas during runtime.
Please refer to HOWTO_alter_existing_kafka_topics.
Elasticsearch API requests
Common considerations for all ES API queries
Elasticsearch cluster is operated and monitored through REST Web API requests.
All these APIs can be invoked using a command-line network tool (curl) or through
the 'development' tab in administration kibana, if your deployment settings have
included a kibana for this specific cluster with the 'development' tab active.
If your Elasticsearch cluster is secured with opendistro
When using development kibana tab, the user credentials that will be used for issuing your Elasticsearch queries is the ones associated to the user logged in kibana. Be sure that you have logged in with an application administrator or platform administrator account, otherwise many elasticsearch queries will be rejected
When using command-line curl, you will have to provide a user name using -u <userName>
and then provide your password when prompted,
otherwise you will receive an unauthorized error message.
Most of the Elasticsearch operation API are starting with <clusterNodeAddress>:<port>/_cat.
The Elastic API web service is available on all nodes of the cluster.
The listening port and network address can be found in the deployment settings file elasticsearch section.
A detailed documentation can be found on the Elasticsearch _cat API Documentation
HTTP Method
by default, the HTTP method to invoke is GET. If an other method is indicated, then
it has to be provided to curl using -X <method> command-line parameter.
_cat APIs
All "_cat" Elastic apis support some common features :
?vurl parameter => will activate the first line "column headers" for more human-understandable output?helpurl parameter => will display lists of available columns?h=column1,column2,...=> will activate an alternate choice of columns (see ?help)
Cluster and nodes information API
Node hello (version and availability)
The most basic of all Elastic node query is the root url greeting :
curl tpesdmst01:9200

{

  "name" : "tpesdmst01_es_data",
  "cluster_name" : "es_data",
  "cluster_uuid" : "MN30PLEhRy22jmL0yapQrw",
  "version" : {
    "number" : "7.10.2",
    "build_flavor" : "oss",
    "build_type" : "tar",
    "build_hash" : "757314695644ea9a1dc2fecd26d1a43856725e65",
    "build_date" : "2020-06-14T19:35:50.234439Z",
    "build_snapshot" : false,
    "lucene_version" : "8.5.1",
    "minimum_wire_compatibility_version" : "6.8.0",
    "minimum_index_compatibility_version" : "6.0.0-beta1"
  },
  "tagline" : "You Know, for Search"
}
Warning
This answer only confirms that the node is up and listening for WEB requests, but it says:
- nothing about the cluster status.
- nothing about the communication between the node and the cluster (may be the cluster is up, and the node is not part of it...)
Once you know a node answers to this request, you can start querying cluster status/info using cat APIs
Cluster overall data health
curl myesnode1:9200/_cat/health?v

   epoch      timestamp cluster   status node.total node.data shards pri relo init unassign pending_tasks max_task_wait_time active_shards_percent
   1605286079 16:47:59  es_search green           1         1      4   4    0    0        0             0                  -                100.0%
- green if all data indices stored in the cluster are available and replicated at the configured level.
- yellow if all data indices stored in the cluster are available, but some requested replication is not achieved (probably because of a missing cluster node).
- red if at least one index has unavailable data (probably because of one or more missing cluster node). Note that when restarting a cluster, all indices are red at first, then turn yellow and green as the stored data files are checked and made available for indexing/querying.
This does not mean that all the cluster nodes are up and joined in the cluster !
You can check the displayed node counts to identify if all the nodes defined in the
deployment settings are accounted for. Details of available nodes in the cluster
can be obtained with _cat/nodes query described hereafter.
Cluster nodes listing/health and storage level
Listing nodes registered in the Elasticsearch cluster, and their resource level (ram, load) :
curl tpesdmst01:9200/_cat/nodes?v

   ip         heap.percent ram.percent cpu load_1m load_5m load_15m node.role master name
   10.1.1.203           60          59   0    0.00    0.01     0.05 dir       -      tpesddat03_es_data
   10.1.1.241           32          65   0    0.00    0.01     0.05 ir        -      tpesdclt01_es_data
   10.1.1.201           41          59   0    0.00    0.01     0.05 dir       -      tpesddat01_es_data
   10.1.1.202            2          59   0    0.00    0.01     0.05 dir       -      tpesddat02_es_data
   10.1.1.191           26          81   0    0.00    0.01     0.05 imr       *      tpesdmst01_es_data
all listed nodes are working elasticsearch nodes that are currently included in the cluster. missing nodes may be either
- not running
-
running in another cluster (VERY not nominal
split-brainsituation coming from a misconfiguration of the minimum master nodes required, and of a network partition). To assess this, you can issue the same curl to each missing individual node, to ensure they are not part of an OTHER cluster.If an expected deployed node is not present in the list, then:
- check on the node machine if the service is up, using systemctl
- check if the ES port is opened (usually 9200)
- checking that network is ok between the cluster nodes (by querying other nodes from the one that did not join)
- check the elasticsearch and journalctl logs for error messages
In case of split-brain, stop the smaller cluster, check the inter-nodes flows to the running cluster, then start each missing node, one at a time, checking they join the running cluster.
Master nodes and other Elasticsearch node roles
For big clusters, it is advised to have separate node holding the 'master' cabability, to act as a leader and synchronization node for the cluster.
The elected cluster master(=leader) is marked with '*'. This node is involved in status
synchronization in the cluster (creating indices, adding columns in indices, taking snapshots or checkpoints
in indices shards for publishing data updates to the query API).
The the nodes allowed to be masters, but not currently leader are marked with a '-'
AND have the 'm' letter in their node.role column.
If less than the strict majority of nodes allowed to be masters are up
the cluster is not available;
The 'd' role in 'node.role' means this node is allowed to store indice data ('data node')
The nodes that have neither the right to become 'master', nor the 'data' role are only
useful for acting as 'client' nodes processing queries on behalf of the search API queries they
receive, forwarding to various data nodes, and aggregating the queries results before sending them to the
API search call issuer.
In Elasticsearch wording, such client nodes are called coordinator nodes. These are
useful to reduce inbalance of RAM/IO consumption in clusters when queries require much
aggregation (like final sorting or reduction of data returned by the multiple data nodes).
More information about node roles can be obtained from Elasticsearch nodes documentation
Resources info on nodes
This command output also displays the overall CPU consumption on each node, and the RAM consumption
inside the Elasticsearch JVM (heap.percent). The ram.percent is usually high, as this includes the system usage of RAM for buffering (so not an issue).
The storage usage level of each node can also be viewed easily by the following request :
curl tpesdmst01:9200/_cat/allocation?v

   shards disk.indices disk.used disk.avail disk.total disk.percent host       ip         node
     2       14.6mb     2.2gb     34.7gb     36.9gb            6 10.1.1.201 10.1.1.201 tpesddat01_es_data
     2        2.3mb     2.3gb     34.5gb     36.9gb            6 10.1.1.203 10.1.1.203 tpesddat03_es_data
     2       17.1mb     2.6gb     34.3gb     36.9gb            7 10.1.1.202 10.1.1.202 tpesddat02_es_data
Indices and shards information API
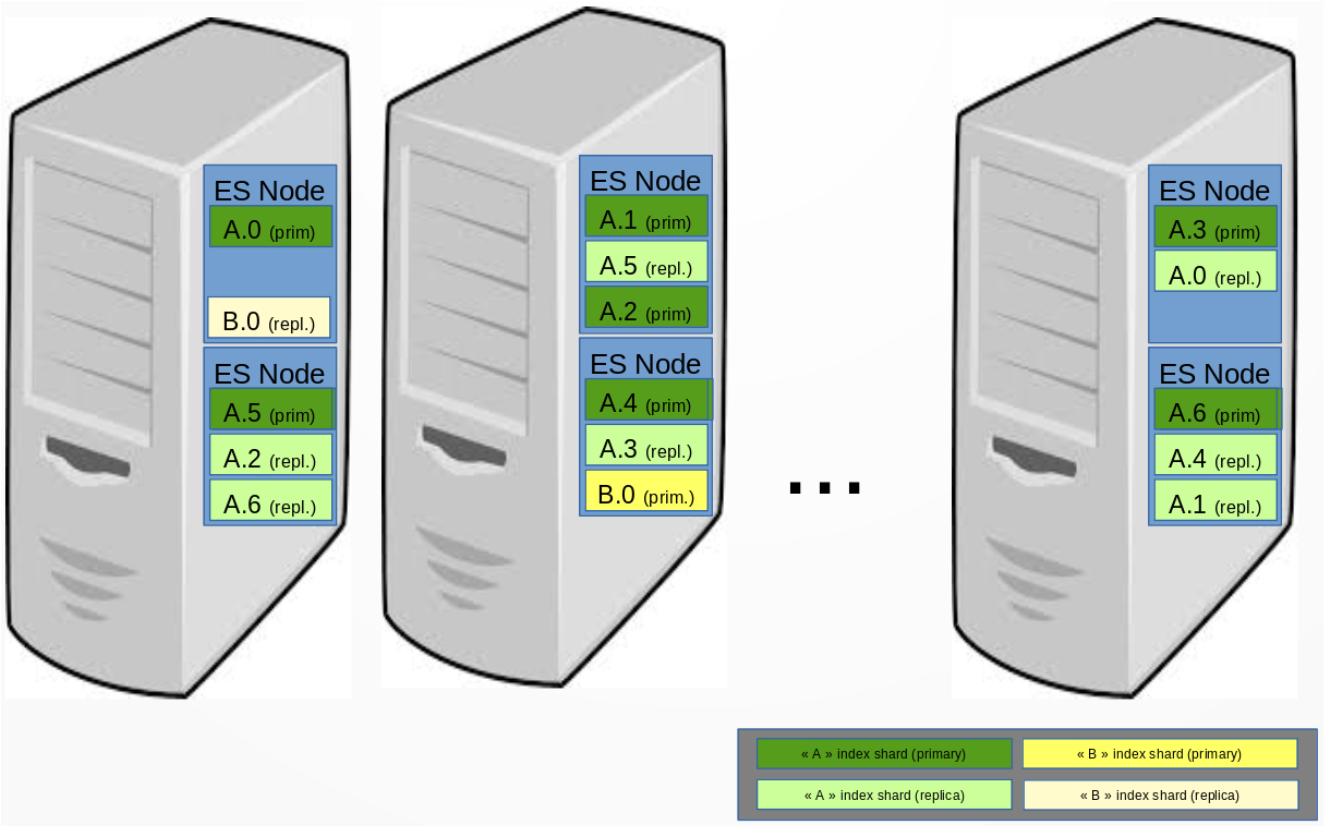
Each Elasticsearch indice (~ database) contains documents. For scalability, the data is indexed in multiple 'shards', and queries are run in all shards of the index, and aggregated by Elasticseach before providing the result.
When replication is required, each shard has its own 'replica'. Elasticsearch takes care of placing replicas on other physical servers than the 'primary' copy.
Elasticsearch will move around shards and indices as needed to balance the storage load, and to rebuild replication on other nodes when some server is down for more than minutes.
Data indices listing/health and storage size
Listing indexes and their individual status :
 $ curl tpesm01:9200/_cat/indices?v

   health status index                                   uuid                   pri rep docs.count docs.deleted store.size pri.store.size
    green  open   platform-channels-monitoring-2020.11.07 _W_rWKfrRQKlLRsAkRS16A   1   1      57357            0      7.8mb          3.9mb
    green  open   platform-channels-monitoring-2020.11.09 bx4KG7kgS8ujpmxFxQ_yCg   1   1      77022            0     10.2mb          5.1mb
    green  open   platform-metrics-2020.11.08             W3p4icklQo-2DoiM22VdTw   1   1     624960            0    171.9mb         85.8mb
    green  open   platform-metrics-2020.11.09             txsAcKO-QByDCH4-fkfqhQ   1   1     624960            0    172.3mb         86.2mb
    green  open   platform-channels-monitoring-2020.11.04 S59vz7y5T6u6mpQjcPaU0g   1   1      40500            0      5.2mb          2.6mb
    green  open   platform-metrics-2020.11.04             qDg1vZCOTjSfYZ33d_Wyvw   1   1     466664            0    130.3mb         65.1mb
    green  open   platform-metrics-2020.11.05             Xu7Jvd33Q4yKiLFuOCMbdA   1   1     284843            0     74.9mb         37.5mb
    green  open   platform-metricbeat-7.10.2-2020.10.28    oPfmM3koQGuShLa85aBqwQ   1   1      11697            0      9.6mb          4.8mb
This command shows:
- the availability/replication
healthstatus of each individual indice - the current
number of documents - the number of shards (
pri), and of additional (replica) copies (rep). - the storage size on disk (with replication, and counting only the primary shards)
- the recently number of re-indexed (overwritten/deleted) documents (
docs.deleted). This is a good indicator of thereplaysof processing that may lead to writing several time a document with same id. This can mean that some instability exists in the punchline or application in charge of writing to Elasticsearch.
Data indices shards location, health and recovery
It is possible to determine individual health and location of each shard inside an index:
curl tpesdmst01:9200/_cat/shards?v

    index                      shard prirep state    docs  store ip         node
    .kibana_1                  0     r      STARTED   137 76.3kb 10.1.1.203 tpesddat03_es_data
    .kibana_1                  0     p      STARTED   137 76.3kb 10.1.1.201 tpesddat01_es_data
    cedricvf-events-2020.10.30 0     r      STARTED 84541 14.9mb 10.1.1.202 tpesddat02_es_data
    cedricvf-events-2020.10.30 0     p      STARTED 84541 14.6mb 10.1.1.201 tpesddat01_es_data
    cedricvf-events-2020.10.29 0     p      STARTED 10051  2.2mb 10.1.1.202 tpesddat02_es_data
    cedricvf-events-2020.10.29 0     r      STARTED 10051  2.3mb 10.1.1.203 tpesddat03_es_data
If some shard is not started, then details can be obtained from the cluster about currently identified recovery actions (i.e. rebuilding of resilience after node failure, moving around replicas for balancing before being able to create new shards...):
curl elasticsearch_data_node:9200/_cat/recovery?v
Indices manual operations API
Indices can be closed (kept on disk, but not available for querying) and opened to make them available again for querying.
This kind of operations can be useful to reduce RAM consumption, while keeping some data
on disk for quick reopening.
Closing/deleting of indices can also be done through automatic Elasticsearch Housekeeping service.
Closing an index (to free memory)
curl -XPOST myesnode:9200/<indexName>/_close
Reopening a closed index
curl -XPOST myesnode:9200/<indexName>/_open
Warning
If you open an indice that has been automatically closed by the housekeeping service, then this service may close it again very fast. To know how to prevent re-closing of an indice, please see How to inhibit housekeeping actions for an Index
Deleting an index
Danger
Please double-check your indice name:
- There is no confirm question before the data is destroyed.
- If you issue this command, this cannot be undone.
curl -XDELETE myesnode:9200/<indexName>
Viewing documents from an index
For troubleshooting or validation purpose, it is possible to view/query indice data using direct Web API :
curl someesnode:9200/<index_name or pattern with wildcard>/_search?pretty

# or with a query:

curl 'someesnode:9200/<index_name or pattern with wildcard>/_search?q=somefield:wantedvalue&pretty
Shiva Task Manager
Shiva is a distributed and resilient task manager in charge of executing various kinds of jobs. It is used to run logstash, spark jobs, plans, and punchlines.
Refer to the Shiva chapter for details. Not that shiva does not provide a command line tool. It only starts task defined as part of a channel.
Storm User Interface
Using a browser, you can connect to the Storm-Ui GUI (usually on port 8080 on the same host as the nimbus/master of the cluster)
servers which are UP and running, and have declared themselves in the zookeeper folder of this storm cluster.
- are the allowed number of Java virtual machines that can be run in the cluster (addition of allocated slots in each )
By clicking on , one can
- the topology (if for some reason, it cannot be stopped using PunchPlatform command-line tool or admin GUI)
- DO NOT USE feature, which is not supported in PunchPlatform yet
- view uptime of the topology
- view at a glance the number of failures on data handling, declared by topology components (i.e. problems which caused a non-ack /retry). If a component has failure, it is a good idea to have a look at the associated log
By clicking on a (Bolt/Spout) in the topology, one can
- See host and port associated to each component instance. This is useful to find associated logs, which will be on this host, in /data/logs/storm/worker-\<port>.log
- See latency generated by this component. If the number is high, some tuning and/or problem analysis is in order on this component (maybe activate some more trace and capture logs for back-office analysis?)
Archiving Tools and Ceph tools
Please refer to object storage operator tips chapter.
Last Internet documentation for ceph open-source product is available at http://docs.ceph.com/docs/master/#