Log Central (LMC)
Goals and features
This reference architecture presents classical patterns for a central ("back-office") log management site. In older documentation, it was called Log Management Central (LMC).
The hypothesis are:
- Logs are collected on remote Log Collectors (LTR) and forwarded to this Log Central site using Lumberjack protocol.
- The Log Central site implements the following services :
- Highly available logs reception from remote collection sites.
- Highly available local logs reception from central-site source devices.
- Logs parsing, normalization and enrichment, with processing adapted to the log source device type.
- (optional) Raw logs forwarding to an external system, with filtering rules based on parsed fields of the logs.
- (optional) Raw logs archiving as compressed CSV files in an S3 Storage device, with a rough-grain indexing of archive (by time scope and device type).
- (optional) Elasticsearch indexing, enabling to search/query/aggregate logs through Kibana UI.
- Monitoring of Central site platform framework and applications synthetic health, and publishing this health through dashboards and REST API.
- Housekeeping the old archived files and indexed logs (purging data oldest than a choosen retention delay).
- Central Monitoring of remote collector/LTR platform framework and applications synthetic health, and publishing this health through dashboards and REST API.
- The central site must protect data and provide high service availability against, when SINGLE failure occurs.
Note that a specific dual-site reference configuration pattern is documented in a separate section.
High-level design :
Two kind of applications exist in a Log Central :
- User logs pipelines (for the cyber/business-oriented logs coming from source devices).
- Platform monitoring applications.
User logs pipelines overview
The following diagram introduces main pipelines component for transporting/processing the business/cyber-oriented logs coming from collected source devices.
Tip
tip use the links below the diagram to jump to reference architecture highlights/reference configuration items for the component.
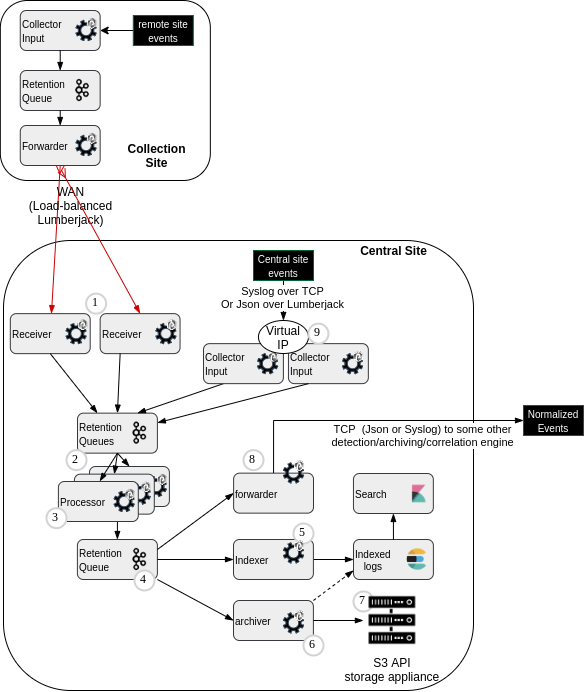
(1) Receiver punchlines (HA cluster)
(2) 'Front' kafka topics (for Fast receiving of forwarded or locally collected logs)
(3) Processors punchlines (for parsing, normalization, enrichment)
(4) 'Back' kafka topic (multiple reader because multiple data outputs )
(5) Indexer punchline (writer to Elasticsearch)
(6) Archiver punchline / meta-data writer (archive indexing)
(7) S3-API-compliant storage device for archives
(8) Syslog/TCP formatter/forwarder punchline
(9) Virtual IP for High Availability of Logs collection
Platform monitoring applications overview
The following diagram introduces pipelines components for transporting/processing the platform and application monitoring data (logs, scheduling events, operator actions, operating system metrics, applications metrics, health reports for platform components and channels)
!!! tip use the links below the diagram to jump to reference architecture highlights/reference configuration items for the component.
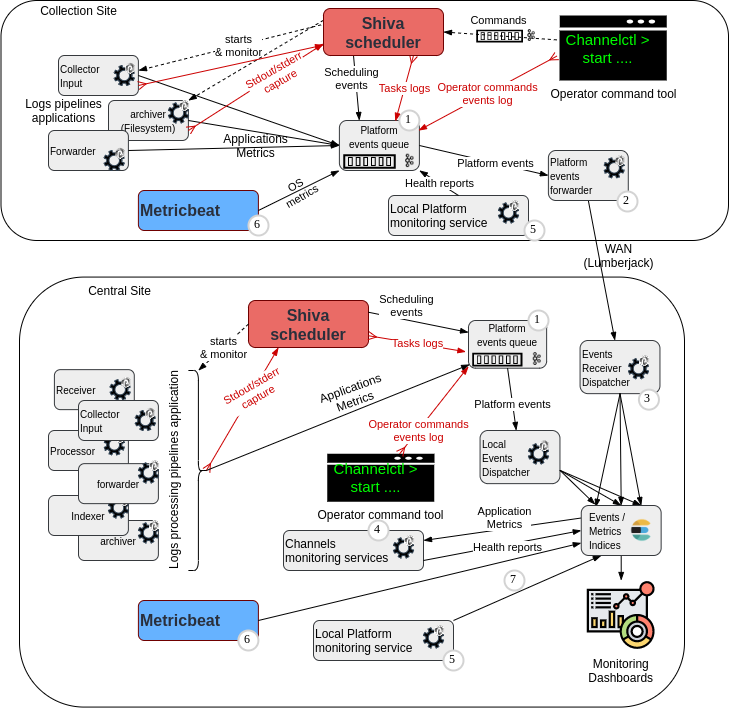
(1) Platform Events Kafka topic (json encoded)
(2) Platform events forwarder punchline
(3) Platform Events dispatcher punchlines
(4) Channels monitoring applications (1 per tenant)
(5) Local platform monitoring service
(6) Metricbeat daemon (OS metrics collector)
(7) Local Elasticsearch metrics reporters
(8) Syslog/TCP formatter/forwarder punchline
Key Design highlights
Front Kafka Topics
Multiple log types arrive in a multiplexed stream. We want to process them with very different Processors punchlines. It is useful to sort them in separate input queues. As a result, if some processor is stuck due to a significant anomaly in the input log flow, the other types of log will be processed normally.
These input queues also serve as buffers, especially or an acti. This makes it possible to process logs later, for example after a communication interruption or during an update on a specific processing channel.
Typically, it is advised to have 7 days of retention on input kafka topics (Long week-end + time to solve an incident) to highly reduce risks of logs destruction during production incident management.
Back Kafka Topics
The output of the Processors punchlines is a parsed json document, a raw log string and some metadata.
Therefore, it is possible to have only one 'output' kafka queue, and a 'big' indexer, forwarder or archiver punchline common to all logs types.
Sometimes, it can be useful to tune indexing to Elasticsearch by log type. Indeed, different log types may have very different amounts of logs, leading to different sizes and shardings in Elastic indices.
In these cases, we can have multiple output kafka topics. But it implies more punchline components (punchlines/kafka input nodes) to read these multiple queues, leading to more configuration and more memory usage.
These 'output' topics are also useful to store the logs during Elasticsearch incidents or maintainance. Therefore, it is advised to size these queues to 7 days of logs.
Virtual IP addresses for High Availability of logs reception
To ensure High Availability of the logs input listener port, there are 2 reference patterns :
-
Smart log senders can be configured with 2 target IP Addresses, therefore no VIP is needed. The sender will switch to the other receiver node if the TCP connection cannot be established.
-
Many log senders can only be configured with only 1 target IP Address, though. Thus, the listening input punchline (on a central collection site or on a remote collection site) is running on multiple input servers, and a unique IP Address is chosen for this cluster of servers, as the logs sender target. This 'virtual' IP is used by only one server at a time, through a cluster of daemons (either pacemaker/corosync, keepalived...) that communicate with each other, and ensure that the IP is correctly published once at any time.
Important
The Virtual IP cluster of daemons must be configured to cause an Virtual IP placement only on a server where the listening port is indeed active. This allows to cope with software failure or maintenance : if the input punchline is stopped on one server, then the Virtual IP is expected to be placed on the other (normally working) input punchline server.
Platform events Kafka topic
On Log Collectors, we have no local Elasticsearch/Kibana service to reduce the required local resources consumption. It is often wished to have central monitoring capability for all collection sites associated to a central logs management site.
So, on collection sites, we use a unique Kafka queue (platform-events') to collect all monitoring/audit information we may need for this monitoring. Then, we forward these pieces of information to the central site.
The internal encoding of data in this Kafka topic is JSON.
We want to be able to receive direct output from various collecting services such as metricbeat for collecting OS-level resources metrics, auditbeat to capture system events.... These beats daemons are natively supporting writing their output as JSON in Kafka.
We could bypass Kafka buffer for monitoring by reporting directly to Elasticsearch. However, it is often more efficient to write to Elasticsearch using an Elastic Output node of a punchline, than directly reporting to Elasticsearch. In the latter case, less documents per request are inserted.
Metricbeat
Metricbeat daemon is a standard Operating-System collector from the ELK ecosystem.
We advise deploying it on all VMs of your platforms. Its metrics should be indexed in the central platform-metricbeat-<date> Elasticsearch indices for a few days. It will help investigating performance and stability issues. Alerting can be based on these metrics in the platform supervision system, by querying these metrics from Elasticsearch.
This daemon is running under direct systemd monitoring/control. No Punchplatform channel or application is requireds to run this service.
Local Elastic metrics reporters
For some central applications, we want to have metrics reported directly to Elasticsearch, without going through the platform-events Kafka topic and the dispatcher punchline.
This is especially the case for the critical dispatcher punchline itself !
It also allows to reduce the load on the central monitoring events dispatching punchline (e.g. having local metribeat daemons reporting directly to the Elasticsearch).
Platform Events housekeeping
In order to clean old metrics and events indices, a housekeeping channel must be configured for the platform tenant.
Here is an example of housekeeping service configuration :
{
  "clusters_settings": [
    {
      "cluster_id": "common",
      "actions": [
        {
          "type": "close_indices",
          "indices_prefix": "platform-logs-",
          "older_than_days": 7,
          "indices_naming_time_format": "%Y.%m.%d"
        },
        {
          "type": "delete_indices",
          "indices_prefix": "platform-logs-",
          "older_than_days": 12,
          "indices_naming_time_format": "%Y.%m.%d"
        },
        {
          "type": "close_indices",
          "indices_prefix": "platform-health-",
          "older_than_days": 7,
          "indices_naming_time_format": "%Y.%m.%d"
        },
        {
          "type": "delete_indices",
          "indices_prefix": "platform-health-",
          "older_than_days": 12,
          "indices_naming_time_format": "%Y.%m.%d"
        },
        {
          "type": "close_indices",
          "indices_prefix": "platform-monitoring-",
          "older_than_days": 3,
          "indices_naming_time_format": "%Y.%m.%d"
        },
        {
          "type": "delete_indices",
          "indices_prefix": "platform-monitoring-",
          "older_than_days": 7,
          "indices_naming_time_format": "%Y.%m.%d"
        },
        {
          "type": "delete_indices",
          "indices_prefix": "platform-channels-monitoring-",
          "older_than_days": 7,
          "indices_naming_time_format": "%Y.%m.%d"
        },
        {
          "type": "close_indices",
          "indices_prefix": "platform-metricbeat-",
          "older_than_days": 2,
          "indices_naming_time_format": "%Y.%m.%d"
        },
        {
          "type": "delete_indices",
          "indices_prefix": "platform-metricbeat-",
          "older_than_days": 5,
          "indices_naming_time_format": "%Y.%m.%d"
        },
        {
          "type": "delete_indices",
          "indices_prefix": "platform-auditbeat-",
          "older_than_days": 5,
          "indices_naming_time_format": "%Y.%m.%d"
        },
        {
          "type": "delete_indices",
          "indices_prefix": "platform-filebeat-",
          "older_than_days": 5,
          "indices_naming_time_format": "%Y.%m.%d"
        },
        {
          "type": "delete_indices",
          "indices_prefix": "platform-packetbeat-",
          "older_than_days": 5,
          "indices_naming_time_format": "%Y.%m.%d"
        },
        {
          "type": "delete_indices",
          "indices_prefix": "security-auditlog-",
          "older_than_days": 12,
          "indices_naming_time_format": "%Y.%m.%d"
        }
      ]
    }
  ]
}
Platform monitoring channels monitoring
To compute a synthetic health report for channels, a channels monitoring service must be configured for every tenant.
Please refer to Channels Monitoring documentation for monitoring rules and configuration. Here is a reference configuration example for the platform channels monitoring service :
monitoring_interval: 30
elasticsearch:
  es_cluster_id: es_monitoring
  es_platform_logs_index: platform-*logs-*
  es_topologies_metrics_index: platform-metrics-*
reporters:
- type: kafka
- type: console
Platform monitoring service
To compute a synthetic health report for the platform, a platform monitoring service must be configured for platform tenant on each site.
Please refer to Platform Monitoring documentation for configuration and API access.
Here is a reference configuration example for the platform monitoring service :
monitoring_interval: 10
services:
- shiva
- zookeeper
- elasticsearch
- kafka
- gateway
reporters:
- type: kafka
  topic: platform-monitoring
  reporting_interval: 30
  encoding: json