Troubleshooting Kibana Standalone
This tutorial is an Punchplatform troubleshooting guide. It assumes that you followed the Getting Started tutorial.
This tutorial is structured as a series of common issues, and potential solutions to these issues, along with steps to help you verify that the various components of your Punchplatform are properly functioning. Feel free to jump to the sections that are relevant to the issues you are encountering.
Impossible to connect to the Kibana interface
You have started your standalone and you tried to connect to localhost:5601 but the UI is not appearing. First check that Kibana is listening on the expected ip:port address. On linux type
netstat -tlnp
With this command you should see the following :
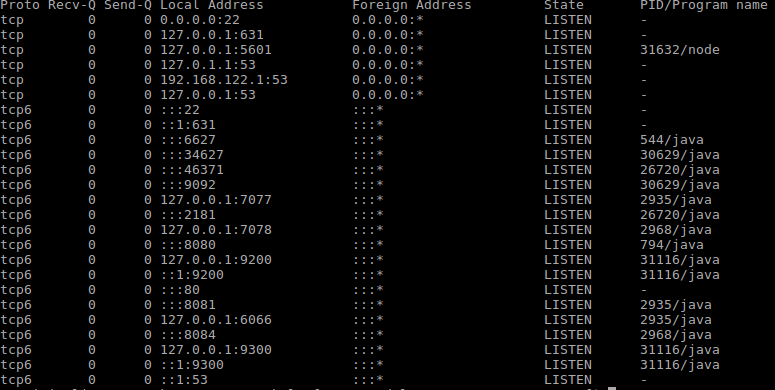
You can check that Kibana is using the local address 127.0.0.1 and listening to the correct port (5601). If you see 127.0.0.1 it means that Kibana is only accessible from a browser launched from that same computer.
If the standalone is installed on a different computer of the one your using, you have two possibilities :
1) first, you can reinstall the standalone using the [ind-to-all-interfaces] option :
./install.sh -s --bind-to-all-interfaces
it will ensure that kibana is bound to all the network interfaces, not just the local loopback interface.
Alternatively, you can update the kibana configuration file. It is located in the $PUNCHPLATFORM_CONF_DIR/../external/kibana-<version>/config/kibana.yml In this file uncomment : #server.host: and modify it to : server.host:
Then restart Kibana :
punchplatform-kibana.sh --stop
punchplatform-kibana.sh --start
Kibana No Default Index Pattern Warning
When accessing Kibana via a web browser, you may encounter a page with this warning:
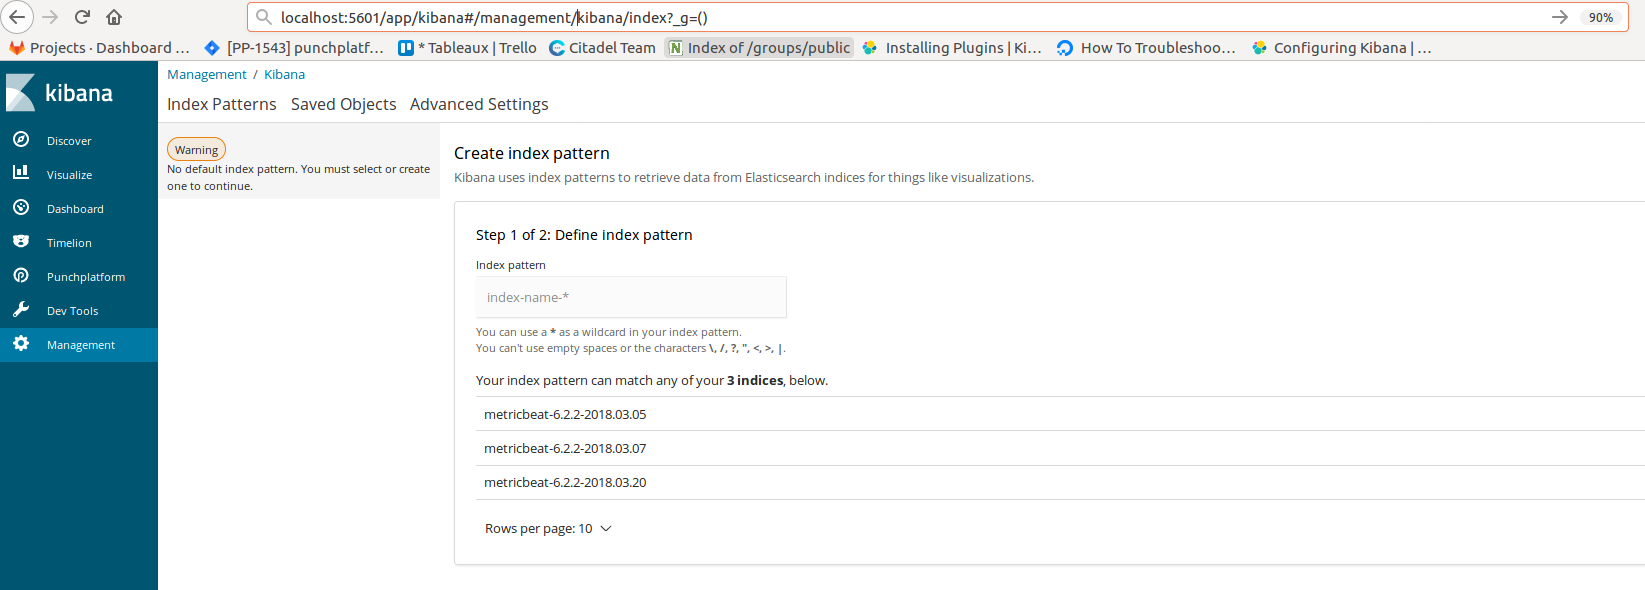
Kibana warning: Warning No default index pattern. You must select or create one to continue. ... Unable to fetch mapping. Do you have indices matching the pattern?
indicates that Elasticsearch does not contain any entries that match the default logstash-* pattern.
The first issue here is that you just didn't configure the index pattern on the UI. In this case, just add it in the management section of Kibana and choose the good timestamp. Then you can check in the discover section that the data are present.
An other possible issue is that your logs are not being stored in Elasticsearch due to communication issues from Punchplatform to Elasticsearch, and/or from your topology. In other words, your logs aren't making it through the chain from your injector or your LTR to the storm parsing topology to Elasticsearch for some reason.
Kibana Unable to connect to Elasticsearch
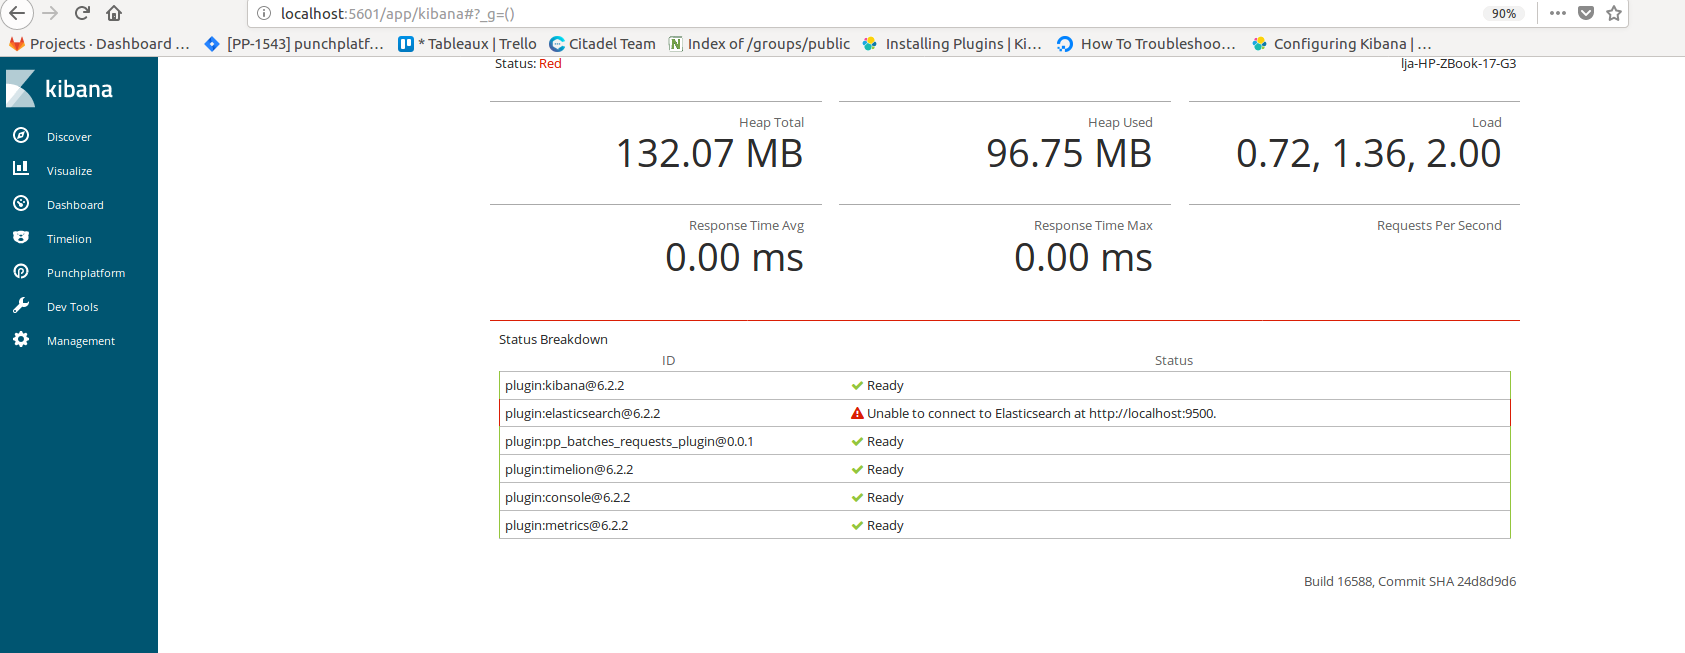
In this case it means that Kibana cannot connect to your elastic search url, it is possible if you modify the default elastic search port which is 9200. By default Kibana is listening to port 9200.
Two possibilities,
1) You can change ElasticSearch configuration so that he is bound to port 9200 2) Go into the $PUNCHPLATFORM_CONF_DIR/../external/kibana-<version>/config/kibana.yml file and in this file uncomment : #elasticsearch.url: and modify it to : elasticsearch.url:
Then restart Kibana :
punchplatform-kibana.sh --stop
punchplatform-kibana.sh --start
Kibana Is Not Accessible
In that case it may simply be that you have forgotten to start your Kibana application or your punchplatform with the following command :
punchplatform-standalone.sh start
Another possibility is that you haven't just waiting enough and the Kibana is loading the plugins, which can take up to 1 minute to be fully operational. In that case you just have to reload the page, if you have read this section to get to the point it should be at least one minute later.
Finally is you want to check that others technology are not the cause of the trouble you can check the status of the platform using the following command :
punchplatform-standalone.sh --status
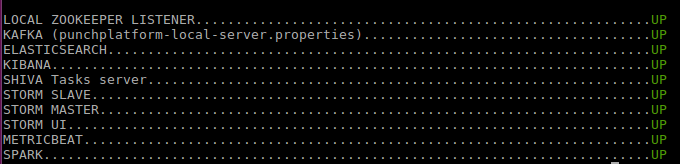
and check that everything is up.
Hope that this guide help you go through your issues, have a nice day with Punchplatform !