HOWTO configure functional tags
Why do that
Functional tags are necessary to obtain a functional overview of the system. With this tags, a user can found a valuable and accurate information on the system without knowing it technically. For example, we often need to know the EPS (event per second) for a technology (apache, bluecoat, etc.). In LMC context, the technology is a functional item. The user doesn't need to know that x executors are running to do the job and must sum the metrics y of each executors of the channel z to have a result.
What to do
First: origin of functional tags
PunchPlatform gives to the user many technical metrics. Some of this metric could be used as functional metrics with custom tags. With this custom tag, the user could request Elasticsearch directly on this tagged metric. A custom tag must be unique for a tenant otherwise you could obtain false results.
Second: add a new functional tag
- Configure your topology with the new custom tag. A custom tag must be unique for a tenant! To configure a topology, add the following section in the component settings :
"metrics_tags" : {
    "technology_ltr_in": "apache"
    },
is the name of your custom tag. PunchPlatform deploys a lot of components on your cluster. To obtain an accurate metrics we must take into account all the components. When you add a custom tag, PunchPlatform automatically add an other tag to take into account the cluster complexity. is an identifier for a task in the cluster. A component could have many tasks !
Third: visualize the metric with your tag
The unicity of the custom tag permits to simplify the Elasticsearch request. You can directly see your the metrics with your custom tag in Kibana :
- Use the index Pattern with the time-field name
- Your main request must contains the tenant selection :
- As X-Axis, do an average on a technical metric (For example :)
- As Y-Axis, use a date histogram with field
- Group by the tag
- In the options, use the
You must obtain this type of view :
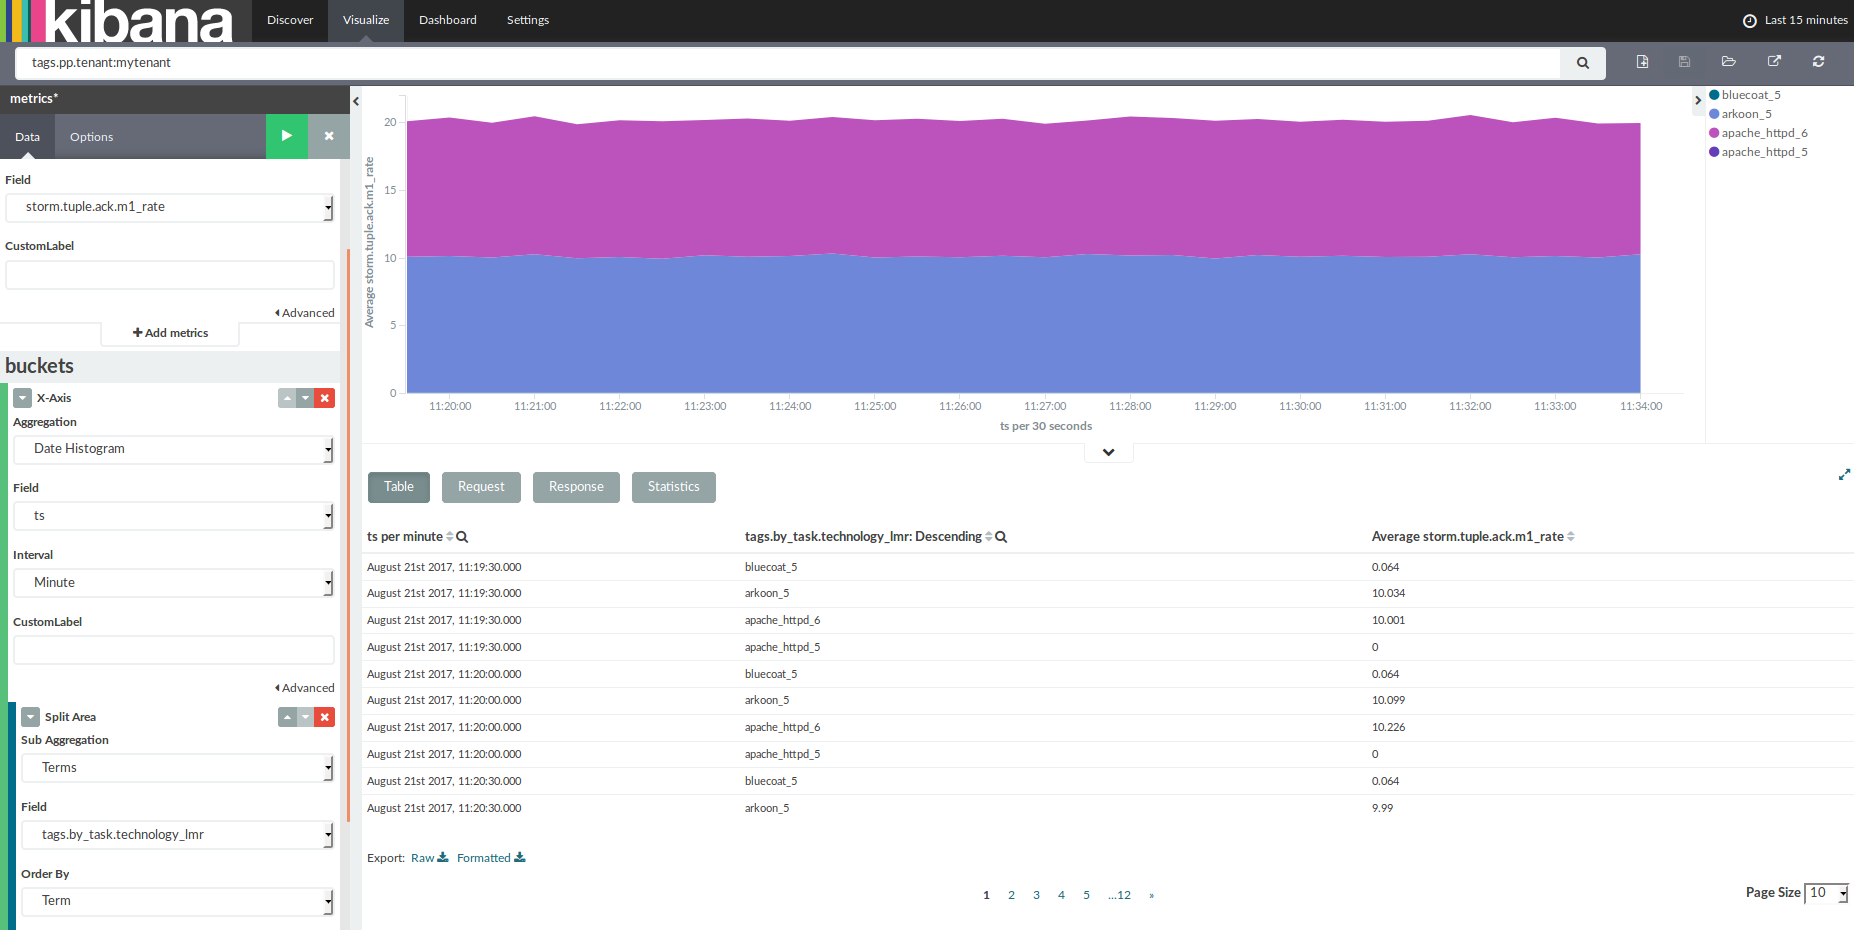
As you can see :
- The request is done on tenant
- concat the value of your customfield and a task _id
Fourth: long term metrics
Technical metrics are not stored in a permanent way. If you want to keep specifically some valuable metrics in a long term way then you have multiple solutions :
- Configure Pygregator to aggregate some metrics and store them in a long term index.
- Configure the reporters of metrics in your topology to send them in an long term index.
- Use an external tool like 'Curator ' to do reindex metrics index.