Monitoring Guide
This chapter explains :
- the available metrics to monitor the system status, performance and capacity
- how to monitor a platform from an external supervision system, such as Nagios
Supervision
This part defines the resources to monitor in Supervision system.
Overview of resources to monitor
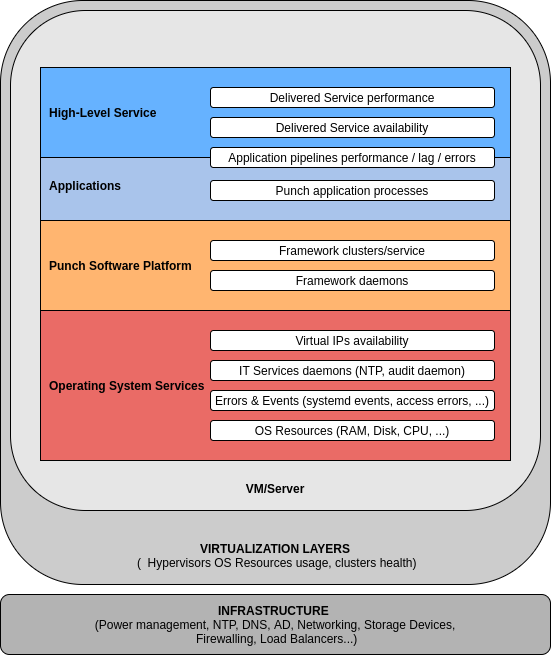
To ensure that Punchplatform system is working, supervision subsystem must at least specifically monitor:
- The running status of a number of key Systemd-monitored services
- The Operating system-level resources consumption of all Punchplatform servers (Disk space, CPU/RAM usage, ...)
- The Health status indicators published by Punchplatform in Elasticsearch (Platform level, Channels level)
Optionally (but very much advised) supervision should also target :
- Channels Kafka Lag/backlog levels metrics obtained by REST-querying of Elasticsearch (the monitoring cluster)
- Application error counts (tuple failures, processing failures) obtained by REST-querying of Elasticsearch
- Systemd error status
- Pacemaker error status (or any other Virtual IP Management framework used at entry points for High Availability of input and Web Access)
Key services to supervise
On PunchPlatform servers, processes are launched and monitored through Systemd .
sudo systemctl | grep Punchplatform  # Here Punchplatform is the user assigned to the framework daemons through platform deployment settings

  elasticsearch.service                                                                    loaded active running   Punchplatform Elasticsearch
  gateway-mytenant.service                                                                 loaded active running   Punchplatform Gateway
  kafka-local.service                                                                      loaded active running   Punchplatform Kafka-local
  kibana-admin-kibana.service                                                              loaded active running   Punchplatform Kibana-admin-kibana
  metricbeat.service                                                                       loaded active running   Punchplatform Metricbeat
  shiva-runner.service                                                                     loaded active running   Punchplatform Shiva
  zookeeper.service                                                                        loaded active running   Punchplatform Zookeeper
- the chosen deployment layout (what runs where)
- the naming of your clusters (kibana, Kafka, zookeeper)
Warning
On Ceph servers, there are multiple ceph daemons (osd, mon, mgr) that
sudo systemctl | grep 'ceph-osd-main@' | ! grep -vi RUNNING
sudo systemctl | grep 'ceph-osd-mon@' | ! grep -vi RUNNING
On all clusters servers that use Virtual IP (LTR nodes, KIB nodes, LMC admin nodes, GRAfana nodes), supervision must ensure services pacemaker and corosync are active
sudo service corosync status
sudo service pacemaker status
Monitoring tools
There are 2 families of needed monitoring tools when operating Punch platform:
- automated monitoring tools (under control of a high-level system monitoring subsystem)
- monitoring tools for humans (how to understand and drilldown/troubleshoot what is not working)
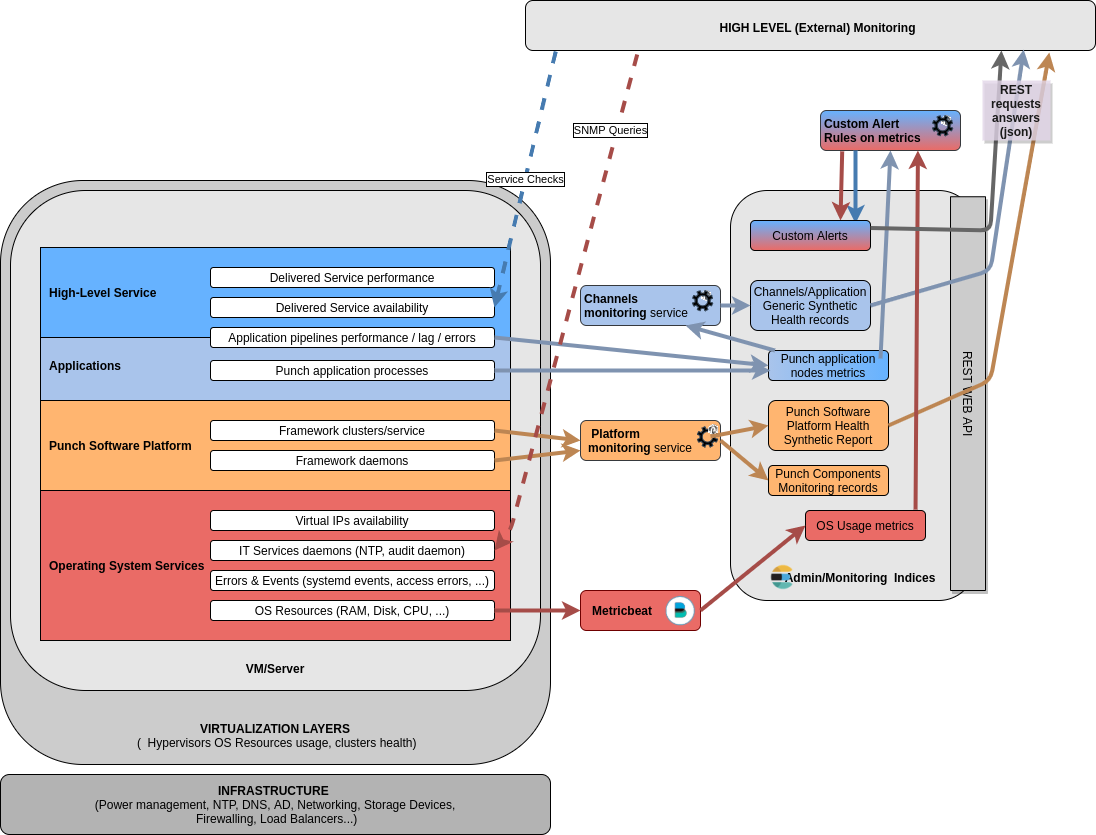
Automated monitoring by high-level supervision product/subsystem
This is typically done by implementing checks or thresholds in a tool like Nagios/Centreon.
These tools can do :
- SNMP queries to retrieve systemd status of running daemons, and OS resources levels
- HTTP checks on high-level Services to ensure availability of End-User HMIs or web services
- REST JSON checks to retrieve health level or metrics values from web services, and trigger alerts by thresholding
On Punch platforms, usual checks are targetted at the Monitoring Elasticsearch instance of the platform:
- synthetic Punch software platform components health from the PunchPLatform Health Monitoring
- synthetic health of each tenant channel application from the Channels Monitoring Service
- thresholding on some key punch nodes metrics that allow to ensure the custom application provides a good service level (throughput, latency...)
- thresholding on some OS Resource usage metrics, if this is not already done through other standard means.
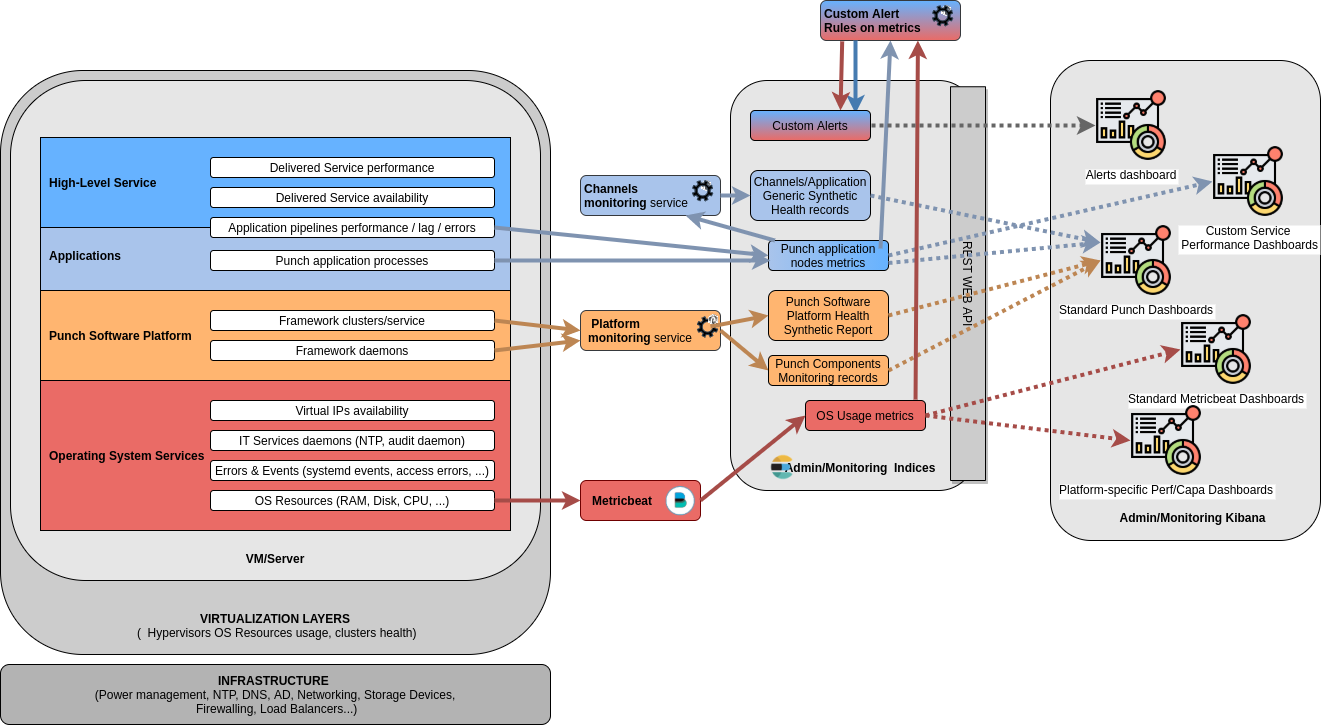
Monitoring for humans
Although a high-level supervision product/subsystem can often provide dashboards or maps to help understand the solution components health status and alerts, detailed drilldown/investigation/capacity management can be done through Kibana based on all data stored in the Monitoring Elasticsearch indices fed by various Punch platform mechanism.
Some monitoring synthetic view is best done through custom dashboards, closely related to - the deployed platform custom structure (number, placement and roles of various clusters or machines) - the deployed application/pipelines custom layout (end-to-end view of queues, rates...)
PunchPlatform Health indicator API
To monitor the platform health using a dedicated tool (Nagios, Centreon, Zabbix, ...), the Punchplatform exposes a JSON API. We keep an Elasticsearch resource updated with the latest platform health state.
This can be queried from the Elasticsearch API by simple check rules in your supervision subsystem, or some custom 'platform' tenant channels can be configured to forward these health status/alerts synthetic information.
This synthetic health records (separate records for distinct Pünch 'platforms') are located at /platform-health-*/_search?sort=@timestamp:desc&size=1. For
example, using curl, you can fetch it with:
# The following requests sends the LAST monitoring health document, for a given platform (Back-Office or LTR)
# you can adapt the "platform.id" filter to target the platform you want the health information about
# Here, we ignore any monitoring document earlier than 15 minutes ago. So if your monitoring query
# does not return the expected "health" field, then this means the platform monitoring is not working (CRITICAL status should then be assigned to the monitoring check)

curl -sS 'http://localhost:9200/platform-health-*/_search?sort=@timestamp:desc&size=1&q=platform.id:mytenant-ltr-a'
The returned document will look like this one:
{
  "took": 0,
  "timed_out": false,
  "_shards": {
    "total": 1,
    "successful": 1,
    "skipped": 0,
    "failed": 0
  },
  "hits": {
    "total": 1519,
    "max_score": null,
    "hits": [
      {
        "_index": "platform-health-2019.06.10",
        "_type": "_doc",
        "_id": "0Bh5QWsBbYsFzAVtaYls",
        "_score": null,
        "_source": {
          "@timestamp": "2019-06-10T13:00:04.300Z",
          "storm": {
            "health_code": 1,
            "health_name": "green",
            "clusters": {
              "main": {
                "nimbus": {
                  "hosts": {
                    "punch-elitebook": {
                      "health_code": 1,
                      "health_name": "green"
                    }
                  }
                },
                "health_code": 1,
                "health_name": "green",
                "supervisor": {
                  "hosts": {
                    "punch-elitebook": {
                      "health_code": 1,
                      "health_name": "green"
                    }
                  }
                }
              }
            }
          },
          "elasticsearch": {
            "health_code": 1,
            "health_name": "green",
            "clusters": {
              "es_search": {
                "health_code": 1,
                "health_name": "green"
              }
            }
          },
          "zookeeper": {
            "health_code": 1,
            "health_name": "green",
            "clusters": {
              "common": {
                "health_code": 1,
                "hosts": {
                  "localhost": {
                    "health_code": 1,
                    "health_name": "green"
                  },
                  "punch-elitebook": {
                    "health_code": 1,
                    "health_name": "green"
                  }
                },
                "health_name": "green"
              }
            }
          },
          "spark": {
            "health_code": 1,
            "health_name": "green",
            "clusters": {
              "spark_main": {
                "health_code": 1,
                "health_name": "green",
                "worker": {
                  "hosts": {
                    "localhost": {
                      "health_code": 1,
                      "health_name": "green"
                    }
                  }
                },
                "master": {
                  "hosts": {
                    "localhost": {
                      "health_code": 1,
                      "health_name": "green"
                    }
                  }
                }
              }
            }
          },
          "kafka": {
            "health_code": 1,
            "health_name": "green",
            "clusters": {
              "local": {
                "brokers": {
                  "0": {
                    "health_code": 1,
                    "health_name": "green"
                  }
                },
                "health_code": 1,
                "health_name": "green"
              }
            }
          },
          "shiva": {
            "health_code": 1,
            "health_name": "green",
            "clusters": {
              "common": {
                "health_code": 1,
                "health_name": "green"
              }
            }
          },
          "platform": {
            "health_code": 1,
            "health_name": "green"
          }
        },
        "sort": [
          1560171604300
        ]
      }
    ]
  }
}
If the platform monitoring is working, then the section you want to examine is under hits > the first hit > _source. For example, using the excellent
Jq utility, you could get it with this command:
curl -sS -X GET '...' | jq '.hits.hits[0]._source'
At its top level, @timestamp is the last update time in ISO format.
The Other fields follow the same structure as the punchplatform.properties
so you will find Kafka, Storm, Elasticsearch and so on.
The "health" keys can take these values:
(0) unknown- the status cannot be defined (monitoring API down) ==> This is more critical than a "Red=3" status, because we don't know !(1) green- everything is OK(2) yellow- non nominal mode, a configuration problem is detected or some nodes are down but the service is still available(3) red- critical failure, the service is down
This document represents the complete platform health. If you only need a subsection of it (let say to only monitor Elasticsearch), feel free to parse it. For example, curl works pretty well with Jq. Depending of your monitoring tool, you can fetch a string or a numeric value:
curl -sS -X GET '...' | jq -rc '.hits.hits[0]._source.elasticsearch.health_name'
yellow

curl -sS -X GET '...' | jq -rc '.hits.hits[0]._source.elasticsearch.health_code'
2
Monitoring rules
To allow appropriate level of response by maintenance teams, especially off-hours and week-ends, the Punch platform monitoring service tries to avoid over-estimating the criticity of failures. This implies specific aggregation rules for going from unitary level (daemon/node) to cluster/service level.
For the details/meaning of each health level for the various punch framework components, please refer to Platform monitoring rules.
The following command-line sample displays all computed high-level monitoring indicators
curl -sS -X GET 'http://localhost:9200/platform-health-*/_search?sort=@timestamp:desc&size=1&q=platform.id:mytenant-ltr-a%20AND%20platform.health_code:>0%20AND%20@timestamp:>now-15m'| jq -c '.hits.hits[]._source | keys[] as $key | select(.[$key]|type=="object") | {"key":$key,"health_code":.[$key].health_code}'

{"key":"kafka","health_code":1}
{"key":"platform","health_code":1}
{"key":"shiva","health_code":1}
{"key":"storm","health_code":1}
{"key":"zookeeper","health_code":1}
Note
To learn more about Jq, a lightweight and flexible command-line JSON processor, refer to the official documentation.
Platform health computation and forwarding
- The platform health documents are computed by the platform monitoring tasks running in a channel of one of the platform tenant ("platform" tenant on a back-office platform).
- On LTR, the platform health documents are forwarded to the back-office through a metrics-forwarding channel (same as for channels metrics or platform metrics).
For information about running the platform health monitoring service, please refer to Platform monitoring task setup
Channels application generic health API
To ease configuration of the external high-level supervision subsystem that is generally used in a production solution (out of punch deployment scope), Punchplatform can compute and publish a synthetic 'health' of each started application.
This can be viewed (by a human) through Kibana in discovery tab (in '-channels-monitoring-' indices) or through a standard Channels health overview dashboard.
This can be queried from the Elasticsearch API by simple check rules in your supervision subsystem, or some custom 'platform' tenant channels can be configured to forward these health status/alerts synthetic information.
Health levels thresholding in supervision rules
When the punch monitoring service computes a health status, it stores the result as both a human-intended string ('red' 'green', 'yellow', 'unknown') in one field, and as a 'health_code' criticity level in an other field. This is useful for setting up automated supervision rules that will fetch this field through REST, and do a thresholding on the value.
The higher the value, the worst is the health !
- To get the current (worst) health code for a whole tenant :
# Replace 'platform' by your tenant name !!!

$ curl -sS 'tpesm01:9200/platform-channels-monitoring-*/_doc/_search?size=1&sort=health_code:desc&q=@timestamp:>now-5m' | jq .hits.hits[]._source.health_code

2
Here, the result (2) indicates the worst channel health for the 'platform' tenant is YELLOW which could be mapped as a warning or error in the supervision system
- To get the current (worst) health code for all the channels of the platform:
$ curl -sS 'tpesm01:9200/*-channels-monitoring-*/_doc/_search?size=1&sort=health_code:desc&q=@timestamp:>now-5m' | jq .hits.hits[]._source.health_code

2
Human troubleshooting
Of course, retrieving a unique health_code field value is useful for synthetic monitoring in an
external supervision system.
For human troubleshooting purpose, either go to the standard kibana dashboard, or use a variant of the command-line query:
$ curl -sS 'tpesm01:9200/platform-channels-monitoring-*/_doc/_search?sort=health_code:desc&q=@timestamp:>now-5m%20AND%20health_code:>1' | jq .hits.hits[]._source

{
  "alert_messages": [
    "Some recent events reported by shiva runner for ever-running task is not nominal."
  ],
  "health_code": 2,
  "@timestamp": "2020-12-11T15:05:23.377Z",
  "health_name": "yellow",
  "type": "channels-monitoring",
  "platform": {
    "application": "events_forwarder_to_central_b",
    "channel": "monitoring",
    "id": "punchplatform-training-collector",
    "tenant": "platform"
  },
  "target": {
    "cluster": {
      "name": "ltr_shiva"
    },
    "type": "shiva"
  }
}
Custom Key application metrics supervision (Kafka Backlog, Tuple failures...)
Although the generic "channels monitoring" service will detect some major malfunction (punchline not starting, or restarting without operator action), this does not guarantee high-level/business-level availability and nominal processing:
- Is the data flowing from the entry to the service end points (User HMI, Database, archiving filesystem...) ?
- Is the throughput satisfactory ? / Do we have unacceptable processing lag/backlog ?
- Is the end-to-end data processing taking too long ? (i.e. processing latency from entry to end point).
- Are we using too much resources / nearing the platform maximum capacity ?
For answering/monitoring these points of the high-level/business-level service, custom thresholding rules have to be designed by the solution integrator and implemented in a supervision rule engine (either an external one like Nagios/Centreon/Zabbix, or Elastalert rules in some 'platform' tenant channel), based on key metrics from all the metrics that Punchplatform application nodes are reporting.
These metrics are usually centralized through the 'platform' tenant applications (see Reference Architecture for monitoring).
This way, they can be queried using Elastic REST API on the monitoring Elastasticsearch cluster.
The most often used key metrics for high-level supervision of proper service performance are:
- kafka consumers "backlog" (for detecting stuck or too slow/overloaded channels)
- streaming tuples failure rate (for detecting stuck channels or unavailable/unstable communication)
- EPS or streaming tuple ack rate (for detecting silent sources or input flooding through too low or too high events rate as compared to some baseline)
- Point-to-point tuple flow latency (for detecting lag/throughput problems/stuck channels)
- metricbeat system-level average CPU for a specific group of servers (for detecting processing or indexing capacity exhaustion)
These key metrics are introduced herafter:
kafka consumers "backlog" monitoring
The "backlog" (also called lag) is the amount of messages that are stored in a Kafka topic, but have not yet be processed by the consuming layer(s) of PunchPlatform channels.
The one you'll want to monitor automatically is probably 'kafka.spout.backlog.unacknowledged.gauge' metric published by all kafka input nodes.
Risks of data loss: put alerts on your critical kafka consumers
Because the PunchPlatform inbuilt log channels health monitoring system is based on monitoring uptimes of application process, and not all applications are using kafka, the backlog raising is NOT automatically monitored by the generic channels monitoring service and API.
It is of high importance to supervise this metric because Kafka will delete old data (when its age or size matches a retention rule of kafka) regardless of whether your applications have read/processed this data or not.
A 'healthy' kafka-consuming application often as less than a few thousands documents in its backlog.
Of course, this is not an absolute, as you may for example have forwarding applications that are expected to have lots of backlog, when the communication is intermittent (like a bus going through its central a few time in the day.)
Hint
For manual viewing of the kafka backlog, if you are on an Elasticsearch-less site, you can either:
-
forward your metrics to a central site that has an Elasticsearch, for example by using Reference architecture metrics forwarding channel. Then you can query this Elasticsearch for the metrics.
-
use some other standard Kafka baclog reporting tool
Kafka consumers are storing their offsets (that allows to compute their lag/backlog) in a standard way inside Kafka itself (_consumer_offsets topic). Because of this:
-
many supervision solutions have a standard 'kafka' agent for monitoring backlogs
-
you can use off-the-shelf commands to view the backlogs and build custom scripts for your supervision rules (e.g. punchplatform-kafka-consumers.sh --describe).
-
Streaming tuples failure rate
Punchplatform Storm/Storm-like applications (most often streaming applications) guarantee the at_least once processing of each input event/document/log through an inbuild 'individual tuple acknowlegement' design.
Whenever a processing or output node fails to execute its action with an incoming document, then it fails the tuple, indicating that the input node should try to retry later the processing.
Depending on the capabilities of the input node, this means that the whole application may be quickly 'stuck', not being able to process new incoming data (because it somehow processes them in order, and is not allowed to 'skip/destroy' any incoming data).
Examples of causes/situation of such 'tuple processing failure' can be:
- an indexing database cluster or node (Elasticsearch, ClickHouse, JDBC) is down, or rejects queries
- a target queuing system (kafka) is not available
- some target system or network of a forwarding is unavailable, unreachable or in some failure condition.
The metric you'll want to monitor automatically is 'storm.tuple.fail.m1_rate' metric published by all Storm/Storm-like application input nodes.
Streaming tuples acknowlegement rate monitoring
Some high-level service nominal working can just be checked through ensuring the average throughput is in an expected envelope:
- Too low means some missing input or some stuck processing
- Too high means some input flood, or some retries/repeats, or some capacity overload risks
In each Punchplatform Storm/Storm-like application (most often streaming application), whenever an input tuple (document/record/log/event) has successfully be processed by all relevent application nodes, then the tuple is acknowleged to the input node that has injected this tuple.
The metric you'll want to monitor automatically is 'storm.tuple.ack.m1_rate' metric published by all Storm/Storm-like application input nodes.
Streaming autotest latencies monitoring
These metrics are generated by:
-
inbuilt test frames injection in all storm application input-nodes, and activated by explicit setting (self_monitoring)
-
propagation of these test frames following explicit '_ppf_metrics' streams publishing/subscribing, and implicitely through kafka output nodes forwarding.
-
each node receiving these frames will generate a 'storm.latency' metric measuring elapsed time in ms between the injection input node and the current node.
Using these metrics (and therefore appropriate configuration of _ppf_metrics in all applications), it is possible to monitor the point-to-point latency (e.g. how much a document takes between input on a collection site and indexation into Elasticsearch in the central site).
Monitoring the Punch monitoring services
The punch monitoring services are based on centralized events and metrics in Elasticsearch.
If for some reason the platform/channels events/metrics collection pipelines are not configured correctly or not operating properly, then the monitoring may not work.
In addition, the monitoring services may be stopped, or may fail due to configuration or other issue.
Because your solution monitoring relies on your supervision alert rules, based (among other things) on these punch monitoring services output documents API, it is therefore highly advised to have active monitoring of the health of the Punch monitoring services.
For that purpose, your supervision solution should also have supervision rules to detect that a given Punchplatform monitoring service has not produced records recently (i.e. lack of recent monitoring records should trigger an alert).