Storm Punchlines
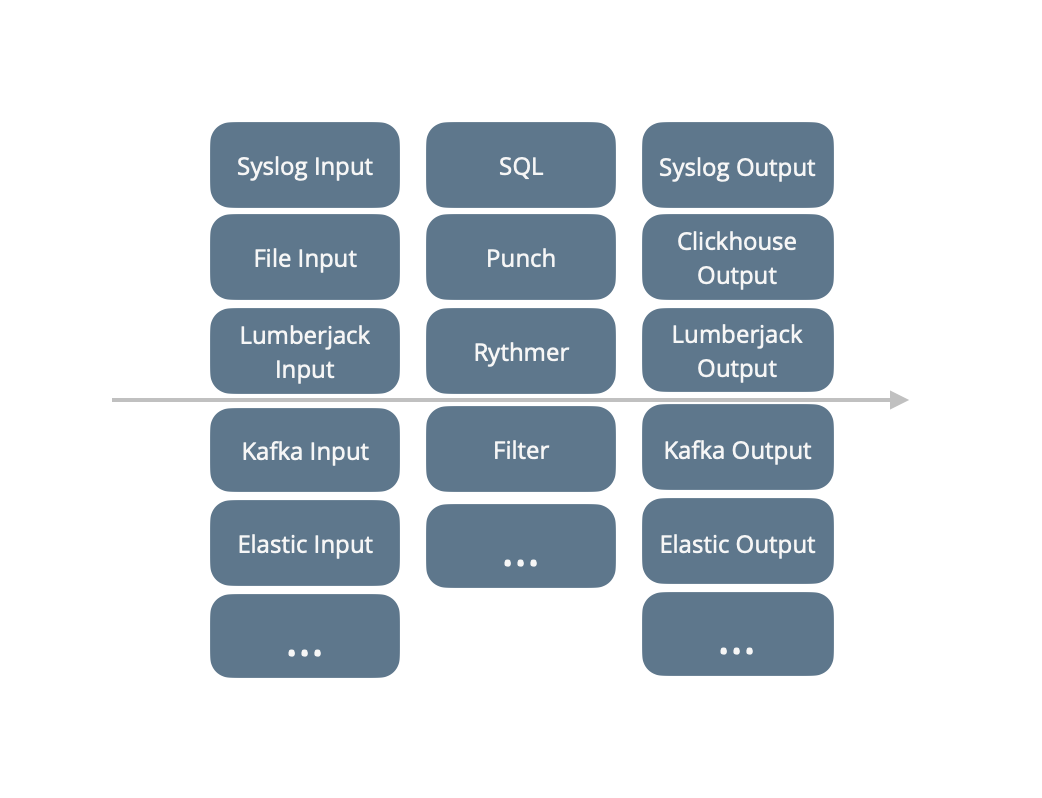
Many punchlines are used to design input-processing-output streaming processors. It takes data from some source using input nodes, process it using processing nodes, and output the resulting data using output nodes. This is illustrated next;
Note
The punch started with Storm concepts and frameworks. Storm is not used anymore but the punch still provides a single thread engine to run such streaming punchlines. That runtime is compatible with Storm APIs, and with its end-to-end acknowledgement model.
The next chapter provides more detailed information on each part.
Configuration
A storm punchline is described by a yaml file which chains nodes
and provides all the required configuration properties. Here is a complete example of a storm punchline. The first node
a local csv file, the second print each line.
version: '6.0'
runtime: storm
dag:
  - type: file_input
    settings:
      path: ./file.csv
      codec: line
      tail: false
      read_file_from_start: true
    publish:
      - stream: logs
        fields:
          - log
  - type: punchlet_node
    settings:
      punchlet_code: '{ print(root); }'
    subscribe:
      - component: file_input
        stream: logs
settings:
  childopts: -server -Xms200m -Xmx200m
Note the settings section. Storm punchlines accept some storm specific settings. These are explained below.
Understanding Streams and Fields
Understanding this section is key for understanding storm punchlines. Please read it carefully.
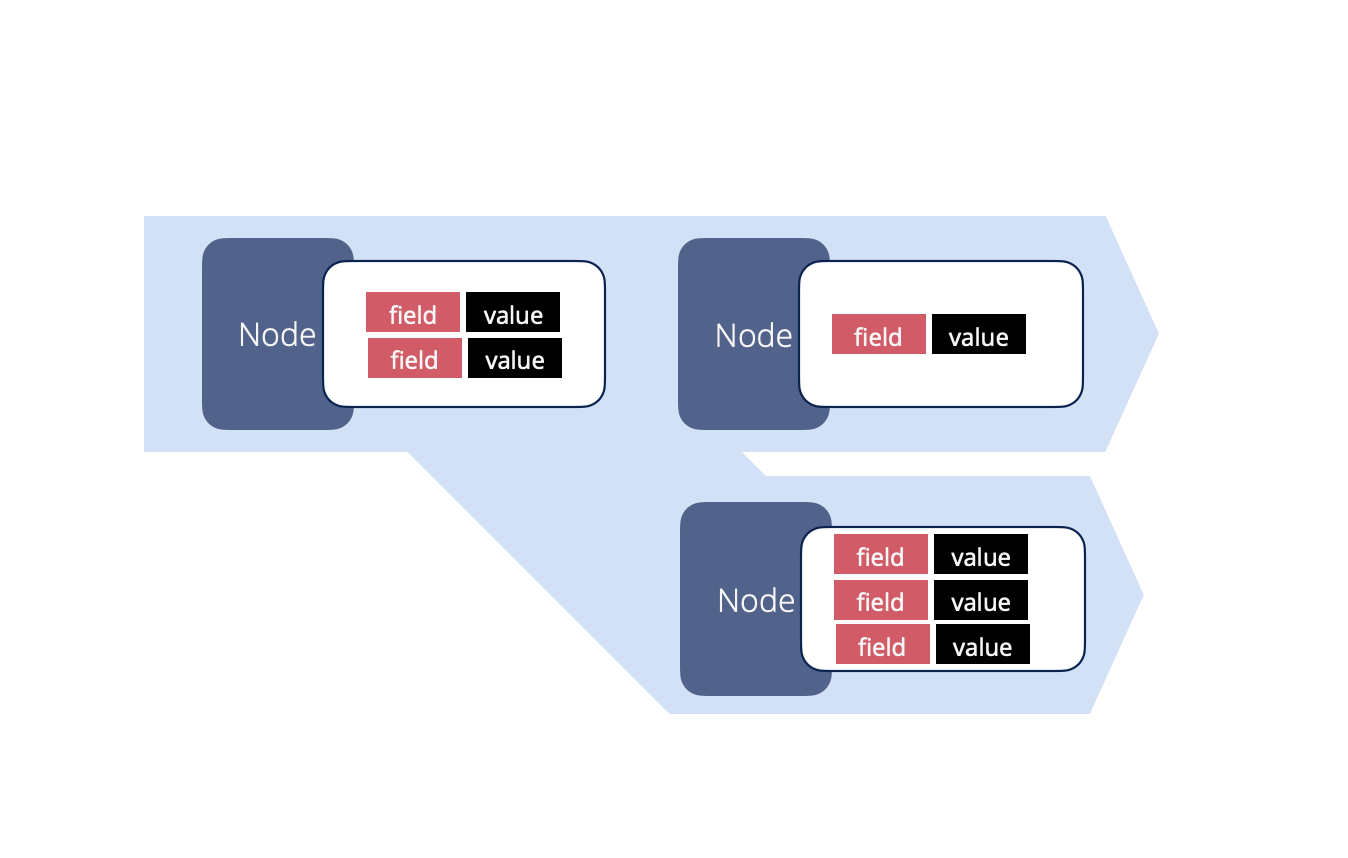
In a punchline, the data flow is implemented using streams and fields. This is clearly explained in the storm documentation. Here is an extract:
A stream is an unbounded sequence of tuples that is processed and created in parallel in a distributed fashion. Streams are defined with a schema that names the fields in the stream 's tuples. By default, tuples can contain integers, longs, shorts, bytes, strings, doubles, floats, booleans, and byte arrays.
These concepts are illustrated next:
You are free to create your own punchlines, however to benefit from important features such as data replay or automatic punchline supervision, your punchlines may include a few special stream and fields.
Example
We will illustrate this with a log management use case. Say you receive logs such as
"31/Dec/2015:01:00:00 user=bob"
The following picture illustrates how such a log is received or read by a node, and emit in the punchline transformed
into a two-fields record called
tuple. Only one node has subscribed to that input node to keep the example simple.
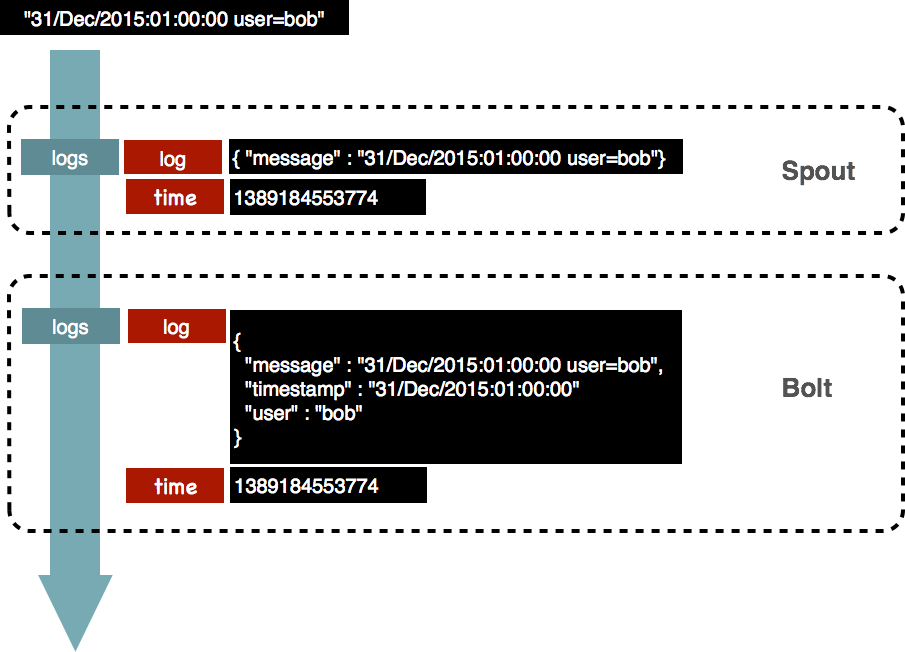
The job of an input node is to insert the data in the dag. It should execute as little processing as possible, because most often it cannot be parallelized. If data transformation must take place it is better to do it in a processing node. In this example the input node emits the logs in a unique stream. The next node will thus subscribe to that stream.
The fields in that stream are used to allow nodes to subscribe to the data, and/or to express the need to receive all
data items according to some specific fields. In our example, it is very simple: the complete log is put inside a JSON
document, emitted in the log field from the stream logs. Another field is used to store a timestamp.
Note
That timestamp is not mandatory and presented here to illustrate our example. This said, it is used in production systems to flag the log with either the time the log entered a Punchplatform, or its creation time by some equipment or application. This timestamp is very useful for monitoring or log replay. Inserting it as a dedicated storm field makes it easy for any downstream bolt to have it at hand.
The processing node in our example punchline will receive a tuple with these two fields. A processing node is a piece of java or python code, in charge of processing the fields content, then emit them (or not) to the next node(s). In the PunchPlatform such a node typically runs a punchlet to do that. A punchlet makes it extra simple to process the data. First, it receives the data as a JSON document representing the complete stream and field structure. In this example it would be:
{
  "logs": {
    "log": {
      "message": "31/Dec/2015:01:00:00 user=bob"
    },
    "time": 1389184553774
  }
}
The punchlet can then parse/enrich the data only by manipulating the JSON document. In this example, a punchlet extracted the timestamp and the user values from the part, and encoded them as dedicated JSON fields. The result is:
{
  "logs": {
    "log": {
      "message": "31/Dec/2015:01:00:00 user=bob",
      "timestamp": "31/Dec/2015:01:00:00",
      "user": "bob"
    },
    "time": 1389184553774
  }
}
And this is what is emitted downstream the dag to the next node. This is the reason the PunchPlatform is so simple to code : you interact with streams and fields only by manipulating a JSON document.
Multi Streams Punchlines
Tuples can be sent on more than one streams. For example to generate an alert in a separate stream, a punchlet can generate something like this:
{
  "logs": {
    "log": {
      "message": "31/Dec/2015:01:00:00 user=bob",
      "timestamp": "31/Dec/2015:01:00:00",
      "user": "bob"
    },
    "time": 1389184553774
  },
  "alert": {
    "user": "bob has been detected !"
  }
}
It is that simple. However, for this to work the punchline must correctly chain nodes to subscribe to the required streams and fields. This is explained below.
Dag And Node Configuration Principles
In a punchline json file, each node is described in a dedicated json section. This section contains a settings
sub-sections for the specific node properties.
Here is an example of a syslog input node:
{
  # the type is mandatory. It specifies the type of storm
  # component valid values are "syslog_spout", "kafka_input",
  # punchlet_node", "kafka_output", "elasticsearch_bolt", etc ...
  "type" : "syslog_input",

  # the storm name of this component. Bolts further the chain
  # interested in  data from this spout must specify this name.
  "component" : "syslog_input",

  # this (syslog) spout specific settings. Refer to the syslog
  # spout documentation for a complete description of each
  # properties.
  "settings" : {
      # the listening address(es). Valid protocols
      # are "tcp", "udp" or "lumberjack"
        "listen" : [
          { "proto" : "tcp" , "host" : "0.0.0.0", "port" : 9999 }
        ]
    }

    # This spout will emit data to the "logs" stream. Each data
    # will have two fields: "log" and "time"
    "publish" : [
      {
        "stream" : "logs",
        "fields" : ["log", "_ppf_timestamp"]
      }
    ]
  }
An inner node is similar, except it also has a subscribe declaration. Here is an example of a Punch node subscribing
to the syslog node just described.
{
  # the Punch bolt executes a punchlet on the stream of data
  "type" : "punch",
  "settings" : {
    # check the documentation for details about loading punchlets
    "punchlet" : "standard/common/parsing_syslog_header.punch"
  }
  "component" : "punchlet_1",
  # it subscribes to the syslog tcp input node. Note how it expresses
  # the stream it subscribes to.
  "subscribe" : [
    {
      "component" : "syslog_input",
      "stream" : "logs",
      "grouping": "shuffle"
    }
  ],
  # this bolt will in turn will emit the data further the punchline,
  # using the same stream and fields usage.
  # Note that it is mandatory to list the possible fields emitted
  # by the bolt.
  "publish" : [
    {
        "stream" : "logs",
        "fields" : ["log", "_ppf_timestamp"]
    }
  ]
}
Finally, to speed up each processing node, you can configure a dedicated number of parallel executors for each node.
This configuration is common to all nodes inside a storm executing environment :
{
  "type" : "punch",
  "executors": 4,
  "settings" : {
    "punchlet" : "standard/common/parsing_syslog_header.punch"
  }
  "component" : "punchlet_1",
  "subscribe" : [
    {
      "component" : "syslog_input",
      "stream" : "logs",
      "grouping": "shuffle"
    }
  ],
  "publish" : [
    {
        "stream" : "logs",
        "fields" : ["log", "_ppf_timestamp"]
    }
  ]
}
Reserved Streams
Using streams and fields you have complete control over your pipeline. In addition, the punch lets you use reserved streams. These are used to forward special values, metrics and errors.
For example in the syslog input node just illustrated the _ppf_timestamp is used to publish the current time in
milliseconds. This value can be forwarded to the final log destination to keep track of the entry time of that log in
the punch application.
Refer to the following javadocs for a descriptions of the various reserved streams and fields.
Error Handling
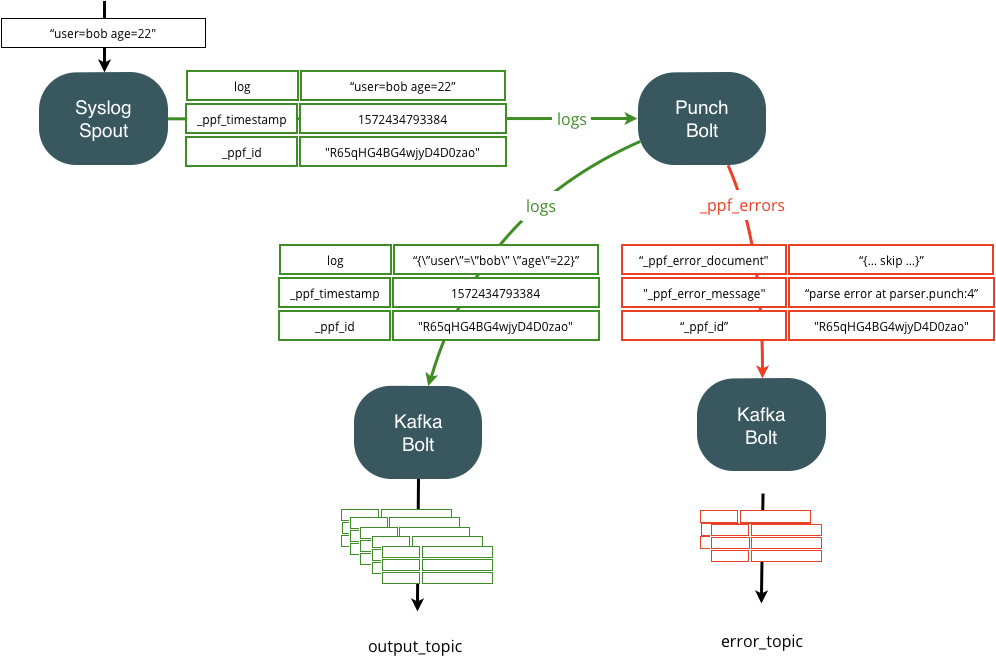
Dealing with errors properly is crucial to not lose data. The following two pictures illustrate how punchlets errors are automatically published on a dedicated error stream, so that you can decide what to do.
The following picture illustrates the basic concept. If a punchlet encounters an error, the error is caught and forwarded along with useful information downstream your punchline. Information include the line number where the punchlet failed, the original data, etc..
As illustrated here you can decide to publish these error records (in red) as part of your regular (non error) traffic. For example by queuing them all in the same output Kafka topic. The same principle can be designed using the lumberjack bolt, also capable of forwarding key-value records.
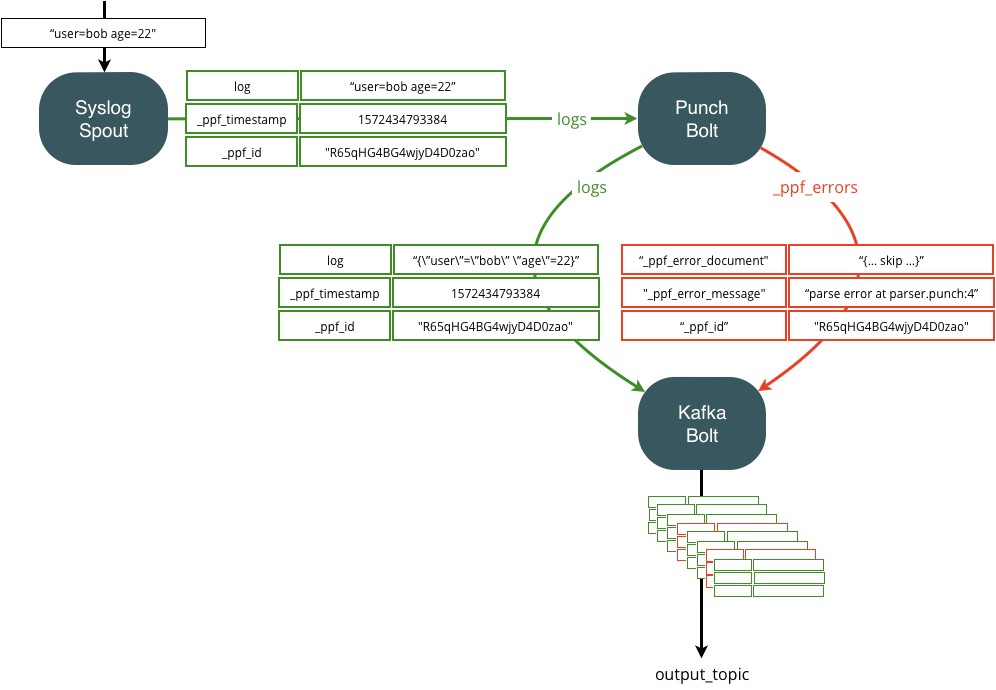
If you do that, you will have to properly configure the next punchline kafka node, to forward both types of data ( regular and error) the way you want. At the end, your goal is to save error data either in an archive or in a dedicated elasticsearch index. The choice is yours.
Because errors are rare, it is a good idea to separate the topics to have one topic for the correctly parsed data, and another one queuing only the error data. You can do that easily as follows:
Refer to the reserved streams and reserved fields documentation for a precise description of the error fields.
Monitoring
Monitoring is a key benefit of using the punchplatform. Punchlines are monitored by two means :
External monitoring services monitor the resource usage of each punchline : kafka topic backlog, cpu, memory etc..
In contrast, internal monitoring services make punchlines publish their own metrics to an elasticsearch backend. Internal monitoring relies on punch metric libraries used from within nodes.
Both external and internal metrics ends up being indexed and stored in an elasticsearch backend.
Note
check the rationale of using Elasticsearch as metrics backend in Metrics and MonitoringGuide. Also Refer to the nodes configuration for more details on metrics associated to each component.
Monitoring Metrics
A punchline publishes metrics so that it can be finely monitored. A punchline publishes two sorts of metrics:
-
per component metrics : each component publishes specific metrics
Refer to each node documentation
-
per component uptime metrics
In addition, each component publishes a so-called uptime metrics that makes it easy to keep track of process restart
-
per java process system metrics
A punchline is composed of potentially several processes. Each process publishes useful metrics to monitor the memory, garbage collection or thread usage of each process.
The principle to activate these metrics is simply to enrich the punchline configuration file with a "metrics" section.
Here is an example:
{
  "metrics": {
    #
    # activate the publishing of per jvm process metrics (heap and non heap memory usage)
    # Possible values are:
    # "jvm.memory" : to activate memory related metrics
    # "jvm.gc" : to activate gc related metrics
    # "jvm.threadstates" : to activate thread usage related metrics
    # "jvm.pools" : to activate buffer pools related metrics,
    #
    "jvm.memory" : true,

    #
    # List the destination metric reporters
    #
    "reporters": [
      {
        "type": "elasticsearch",
        "cluster_name": "es_search"
      },
      {
        "type": "logger",
        "reporting_interval": 5
      }
    ]
  }
}
Metrics Reporters
Each punchline can be configured with one or several metric reporters, in charge of publishing the generated metrics to a given destination. Here is an example:
{
  "dag": [
  ],
  "metrics": {
    "reporters": [
      {
        "type": "elasticsearch",
        "cluster_name": "es_search"
      },
      {
        "type": "logger",
        "format": "kv",
        "reporting_interval": 5
      }
    ]
  },
  "settings": {
  }
}
In the above example, the punchline forwards its metrics to both an Elasticsearch cluster and a log file.
Please refer to the metric reporters section to cover all the existing possibilities.
Traversal Time
Among the many published metrics, one of them deserves a particular attention as it is extremely useful to track the end-to-end traversal time of your data, across one or several Kafka hops. Each input node can be configured to periodically generate a traversal time tracking message that will be published onto a reserved stream. Here is an example to activate this every 30 seconds:
{
  "dag": [
    {
      "type": "some_input_node_type",
      "component": "your_component_id",
      "settings": {
        "self_monitoring.activation": true,
        "self_monitoring.period": 30
      },
      "publish": [
        {
        },
        {
          "stream": "_ppf_metrics",
          "fields": [
            "_ppf_latency"
          ]
        }
      ]
    }
  ]
}
These settings make the input node publish a special message on the stream
_ppf_metrics with a single field _ppf_latency. It is then up to you to have your bolts subscribe to that
stream/field and forward it to where you need, possibly across Kafka or lumberjack hops.
The following picture illustrates how it works. Latency records are inserted as part of the traffic, and forwarded on one of the punch reserved stream. As illustrated here, both regular data and latency metrics will traverse through Kafka topics or lumberjack connection from one punchline to the next one.
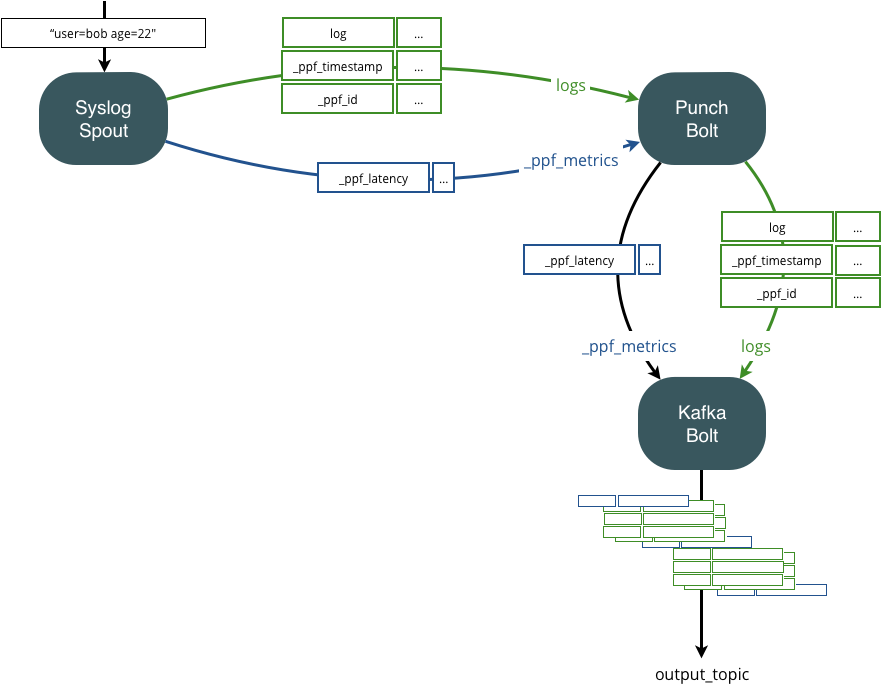
By using the punchline publish subscribe capabilities, you can easily route these metrics up to a central location to keep an eye on the applicative traversal time of all your punchlines, possibly distributed among several sites.
Be aware that nodes do not process latency record. Nodes only add a traversal time in the latency record when they forward it to the next node. Then, the reporters of your topology will collect those latency records. You can redirect those latency records from where the reporters store their metrics.
For example in standalone, the topology mytenant/apache_httpd/input generate some latency records. The Kafka Reporter
for the topology collects latency records. Then, the topology platform/monitoring/local_events_dispatcher indexes
those latency records into ElasticSearch in *-metrics-*.
Custom Metrics tags
To ease dashboard, and to allow metrics selection based on user-provided tags, you can include metrics tags in the settings. These are key/values, that will be automatically be appended as context tags in the published metrics.
Here is an example:
{
  "settings": {
    "self_monitoring.activation": true,
    "metrics_tags": {
      "technology": "{{channel.vendor}}"
    }
  }
}
Chaining Punchlines
Depending on what you decide to do you will deal with three kinds of data :
- regular data
- error data
- latency monitoring record
In order to route these to the final destination of your choice, you simply must properly configure your punchlines Kafka or Lumberjack nodes to forward these data to streams you can then keep forwarding.
A picture is worth long explanations. Say you have a single Kafka topic that includes all type of data. What you want to achieve is something like this:
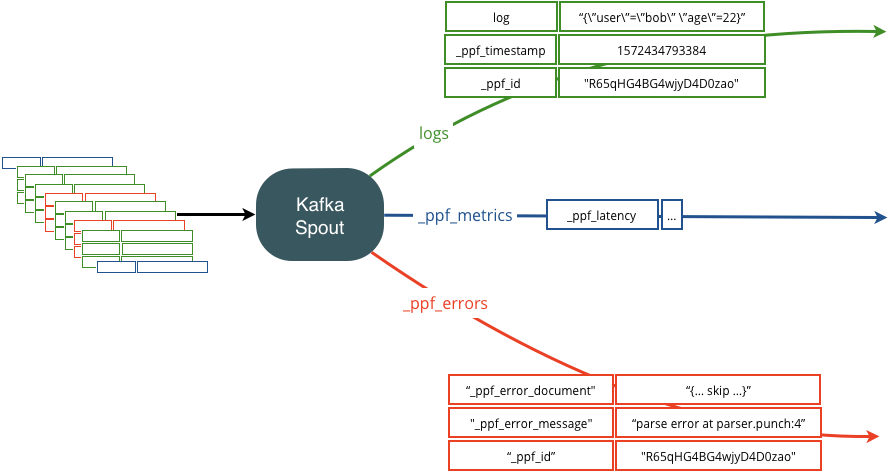
To achieve this, here is what the Kafka input node configuration looks like:
   {
  "type": "kafka_input",
  "component": "input",
  "settings": {
    "topic": "input_topic"
  },
  "executors": 1,
  "publish": [
    {
      "stream": "logs",
      "fields": [
        "log",
        "_ppf_id",
        "_ppf_timestamp"
      ]
    },
    {
      "stream": "_ppf_metrics",
      "fields": [
        "_ppf_latency"
      ]
    },
    {
      "stream": "_ppf_errors",
      "fields": [
        "_ppf_error_message",
        "_ppf_error_document",
        "_ppf_id"
      ]
    }
  ]
}
Advanced Settings
Tuple acknowledgements
By default, Storm is resilient. All tuples are acknowledged by bolts, and these Acknowledgments are reported back to the originating input nodes. This is however not needed on some of your punchlines. In particular front end punchlines (the LTR input punchlines for examples), do not need it.
Because it has a CPU costs, it is best to disable it if you do not need it. To do that include the following in the storm settings section of your punchline:
{
  "settings": {
    "topology.acker.executors": 0
  }
}
Warning
This parameter is not take into account when executing your punchline in light mode
JVM memory setting
The memory allocated to each punchline process is defined in the [settings] section of the punchline configuration file. There are two ways to set jvm memory.
Using onheap memory (privileged for cluster storm)
You must use this setting if you plan to use the ResourceAwareScheduler (default scheduler for storm cluster). You must ensure that worker.childopts at deployment must not define Xms or Xmx values.
{
  "settings": {
    "topology.component.resources.onheap.memory.mb": 128
  }
}
topology.component.resources.onheap.memory.mb * number_executors MB.
Using topology.worker.childopts
!!! Warning Using this setting, when launching the punchline in a storm cluster, can lead to errors of assignment ( supervisors node with to many punchlines).
{
  "settings": {
    "topology.worker.childopts": "-Xms512m -Xmx512m"
  }
}
Sizing consideration
How much do you need ? There are two uses cases. Punchlines that only process and forwards data, (such as Log Parsing
or forwarding punchlines)
require little memory. Make sure you give enough memory so that the number of pending tuples (20000 in our example) will
fit in.
Be careful though : the more nodes you have in a punchline, the more memory and CPU you need.
Stateful punchline performing aggregations require much more RAM, it is up to you to estimate the requirement in function of the batch size and or period.
!!! Warning if your punchline use big resource files, set your memory accordingly. If you experience OutOfMemory errors in test or production, it means you do not have enough.
CPU settings in storm cluster
Storm cluster allows you to define arbitrary weight to your punchline in order to represent the cpu consumption. Each Supervisor comes with a percentage of available CPU declared at deployment phase by the setting supervisor_cpu (1 CPU ==> 100%). With the following setting you control how many cpu are used by each executor declared (default value to 10)
{
  "settings": {
    "topology.component.cpu.pcore.percent": 30
  }
}
!!! Warning This setting does not limit the punchline process in cpu consumption.
Storm ResourceAwareScheduler assignment
When using ResourceAwareScheduler, storm nimbus proceed in the following order to create and assign workers.
- Identify the JVM size of the punchline
- Identify the cpu size of the punchline
- split the punchline in as many workers as needed to fulfill the requirements on the remaining resources
!!! Warning ResourceAwareScheduler split punchline on multiple workers over multiple supervisor nodes (e.g. kafka_input node and punch node on worker 1 while kafka_output node is on worker 2) . Moreover, the topology.worker.max.heap.size.mb must be used with caution as it can involve the scheduler to split your punchline.
Overload control
Overload control is an important parameter to understand. If not setup correctly, the punchlines may experience Tuple failures and retry, resulting in an under-performant behavior.
The native Storm mechanism based on the number of pending tuples allowed per spout in a punchline. For example with the following setup:
{
  "settings": {
    "topology.max.spout.pending": 2000
  }
}
You allow only 2000 messages (i.e. tuple) in a punchline. If your punchline contains a processing or output node that can only cope with less than 2000 messages per seconds, you will be quick to reach that number of pending message and the runtime engine will stop process incoming data. The way it is achieved is simply to stop requesting data from the input node. That means that your (say) socket or Kafka input node will stop reading data, resulting in slowing down you socket client, or filling your Kafka backlog.
Note that at high rate, even if your output node can cope with 2000 messages/seconds, you are likely to accumulate more in the punchline. As a rule of thumb allocate three to five time the maximum rate your punchline is expected to cope with.
Punchline Slow Cpu on Failures
To make a punchline automatically slow down if the traffic completely fail, use the following settings.
{
  "settings": {
    "topology.enable.slowfails": true
  }
}
Punchline timeout
Timeout control is an important parameter to understand. If not setup correctly, the punchlines may experience Tuple failures and retry, resulting in an under-performant behavior.
{
  "settings": {
    "topology.enable.message.timeouts": true,
    "topology.message.timeout.secs": 10
  }
}
In this example, the timeout is enabled and the value is set at 10 seconds. It means a tuple will fail if no acknowledgment is received by the input node in the next 10 seconds. The tuple will be sent again by the node.
Usually, 30 or 60s is sufficient for a punchline between two kafka cluster. If you send data through a slow network, index data in a large elasticsearch cluster or compress a large amount of logs before write them to a block storage 120 or 240s is a better configuration.
Scale a Punchline in multiple Workers
The Storm runtime supports the execution of a punchline in several processes called workers.
To increase performance, a punchline can be configured to run in a multiple process. The following example show how to configure a punchline to run in two workers:
{
  "settings": {
    ...
    "topology.workers": 2,
    ...
  }
}
Warning
This parameter is not take into account when executing your punchline in light mode
Storm and Nimbus specific options
In addition, of specific parameters presented above, other Storm and Nimbus parameters can also be set in punchline settings section to override default values :
{
  "settings": {
    "nimbus.thrift.max_buffer_size": 1024000
  }
}
Check this documentation to have more details about these parameters
nimbus" or "storm
Moreover, these parameters are not take into account when executing your punchline in light mode