Punch Platform health monitoring dashboards
These standard Kibana dashboards are used to monitor the health of the Punch Software framework components both at platform level and channels/applications level (see Monitoring guide).
How to import them ?
These dashboards are provided in the standard resources provided in the resources/kibana/dashboards/platform_monitoring folder of the deployment package.
They can be imported by using punchplatform-setup-kibana.sh (Please refer to post-deployment configuration documentation.
Platform Health Overview dashboard
Once imported, this dashboard is named [Platform Monitoring] Platform Health Overview in your Kibana.
This dashboard only provides a visual information of the worst known health status of each cluster type in the platform in the selected time range.
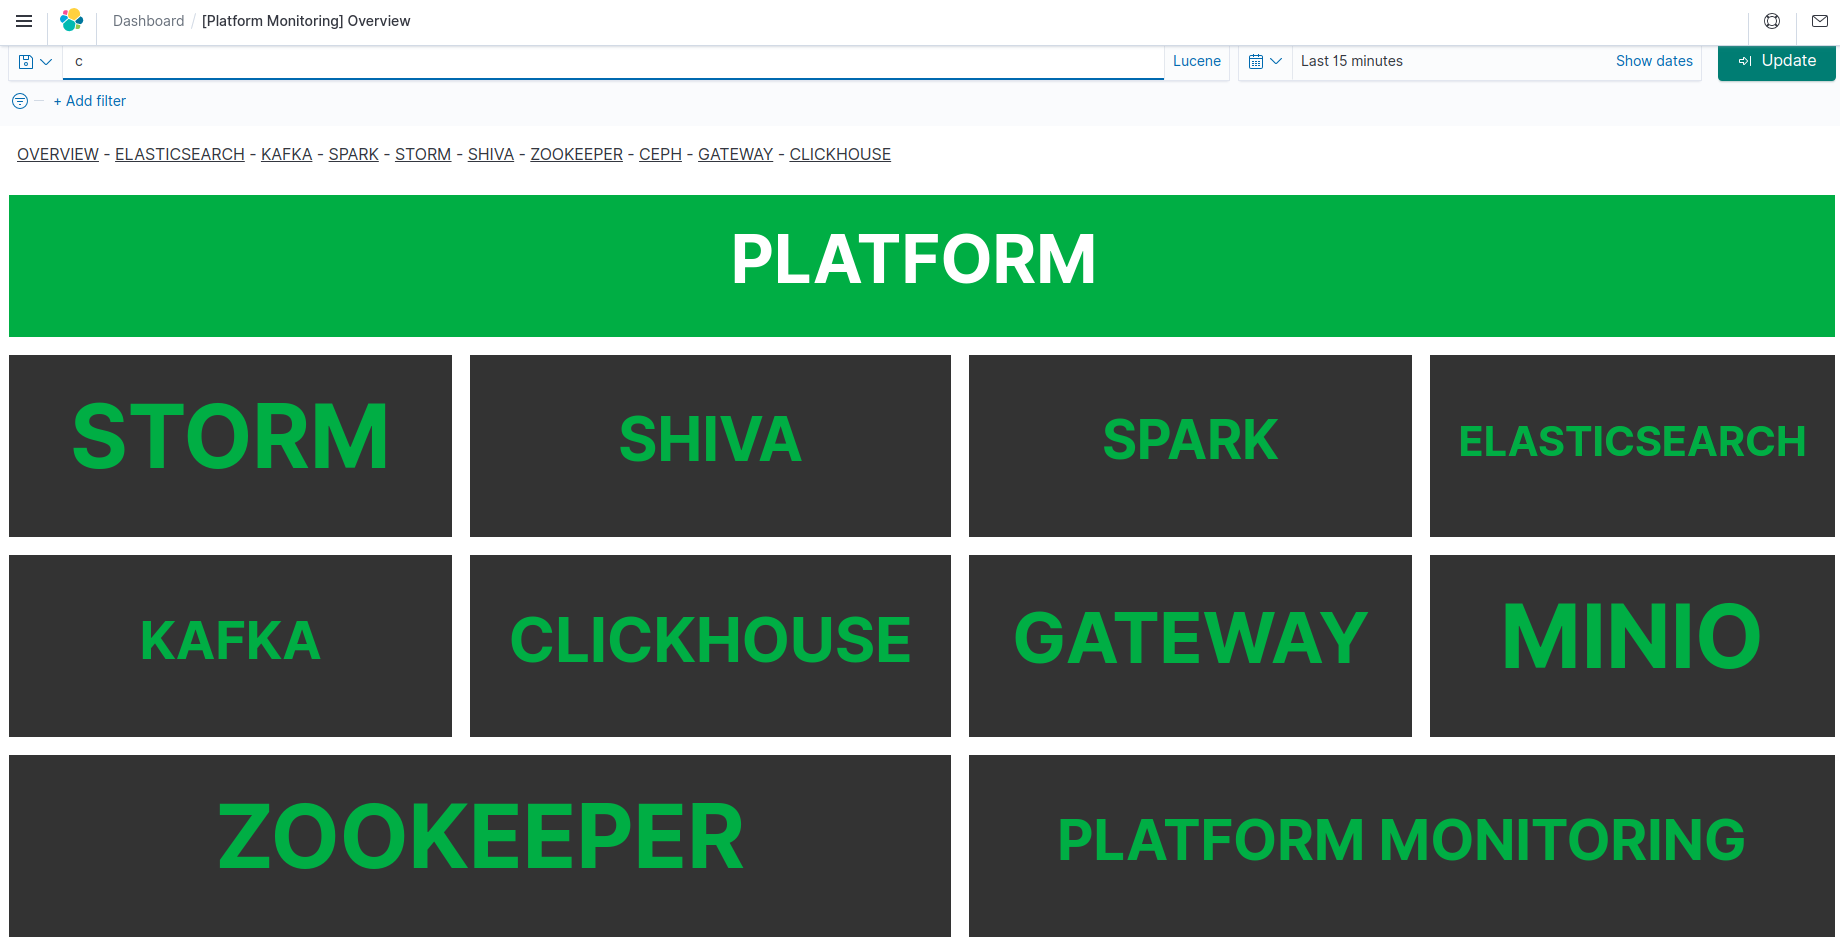
If multiple clusters of the same type, or multiple platforms health records are present, the "worst" health status is displayed (e.g. the worst health of all Elasticsearch clusters from all monitored platforms)
The data is obtained by querying the platform health API document.
The interpretation of "Health color" is given by the Platform monitoring rules documentation.
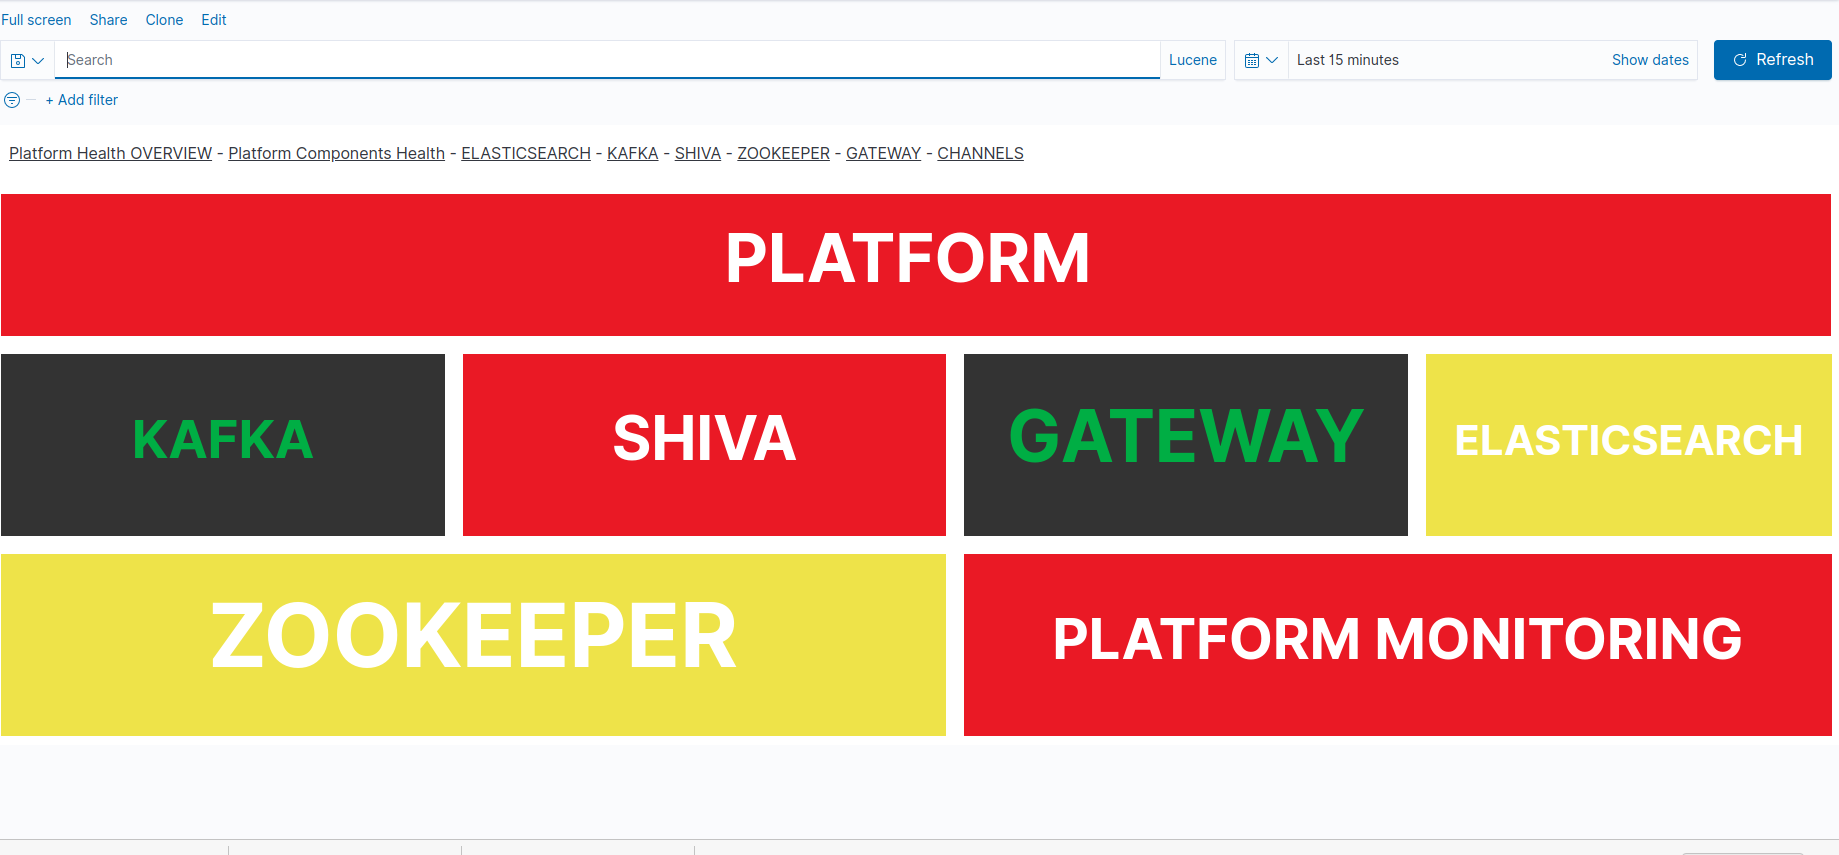
Troubleshooting non-green status
If one of your framework clusters family is not GREEN, then you can have details on the actual faulty cluster/platform and associated alert messages by switching to the Platform components health alerts dashboard
The pink color is associated to an UNKNOWN status, which is often assimilated to the RED/CRITICAL condition (if we do not know, let's assume it is not working).
The Platform Monitoring cells is very important: if it is not GREEN then it means the display cannot be trusted (no monitoring information in the selected time range).
Important
For current health status of the platform, remember to select a short enough time range, because the displayed health is the worst from the selected time range, not the last known.
For your platform
Although the platform is generic enough, it is better to customize it for your platform in order to remove framework components that you do not need (e.g. Clickhouse or minio).
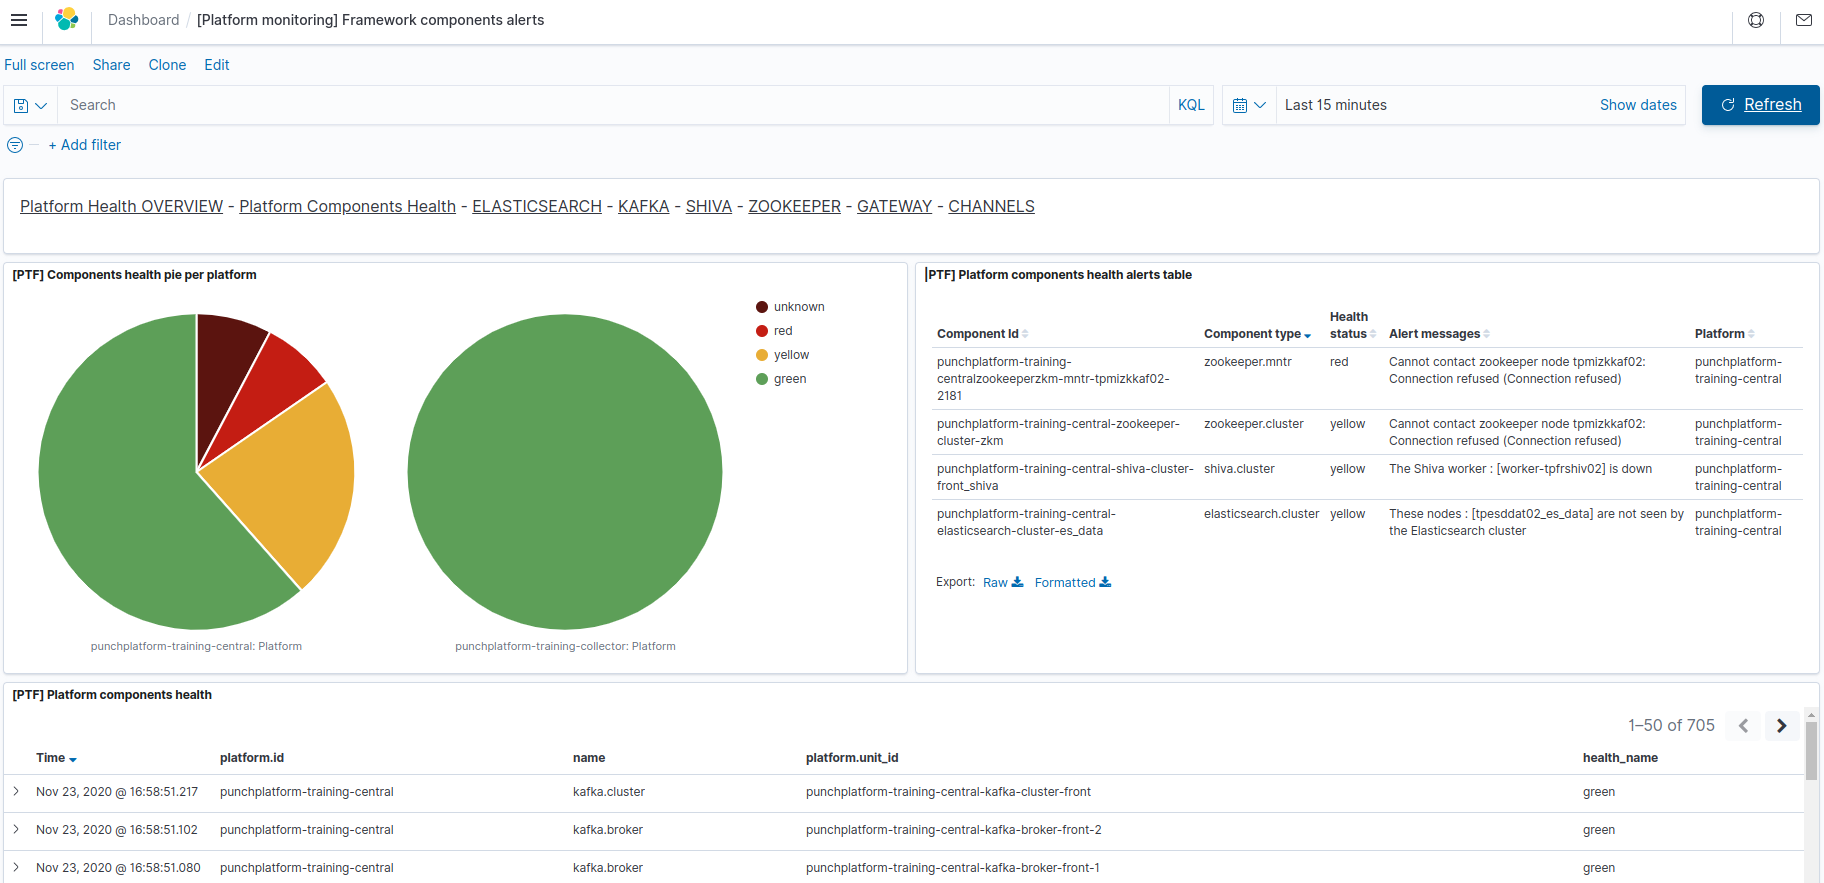
Platform components health alerts dashboard
Once imported, this dashboard is named [Platform monitoring] Framework components alerts in your Kibana.
This dashboard allows access to the detailed results (health level / alert messages) for each indivdually monitored framework component.
It also provides a visual status of the health for each separate platform for which the platform monitoring data is received (see Metrics Forwarding Reference Architecture.
This dashboard is based on records of the "platform-monitoring-*" indices from the monitoring Elasticsearch instance
This dashboard is made of the following views:
-
[PTF] Components health pie per platform (top left)
This synthetize the health level of each separate monitored platform by aggregating the health levels of all components types of said platform (e.g. one pie for the central processing/indexing platform, one pie for each remotely-monitored collector pl A fully green pie means that no framework component has been monitored as faulty during the selected time range.
-
[PTF] Platform components health alerts table (top right)
This table shows the last known alert messages of components that are not in nominal(green) health condition. Items shown here are individually monitored components of the platform (daemons or nodes, or clusters). For each faulty monitored component, is provided its type, its unique component identifier (
<platform>-<clusterOrUnitId>) and the computed health level associated to the last known alert messages.Warning
Because this view only shows last known alert messages, a component which is now healthy may still be displayed here, if the selected time range encompass a time when this component was indeed in non-nominal health status.
-
[PTF] Platform components health
This table show records produced by the platform monitoring task.
In addition to the obvious health level, each record can (depending on the component type) provide additional metrics or information acquired during the monitoring. Please unfold the record by clicking on the arrow to the left of each record, to see available fields of the monitoring record.
Important
For current health status of the platform components, remember to select a short enough time range, because the displayed health is the worst from the selected time range, not the last known.
So if you want accurate current health status of each component, and to hide alert messages that do not apply anymore, please reduce your selected time range to a few minutes (but be careful: less than 2 minutes may be not enough for the monitoring data to be computed and published by Elasticsearch for display in Kibana).
Channels health overview dashboard
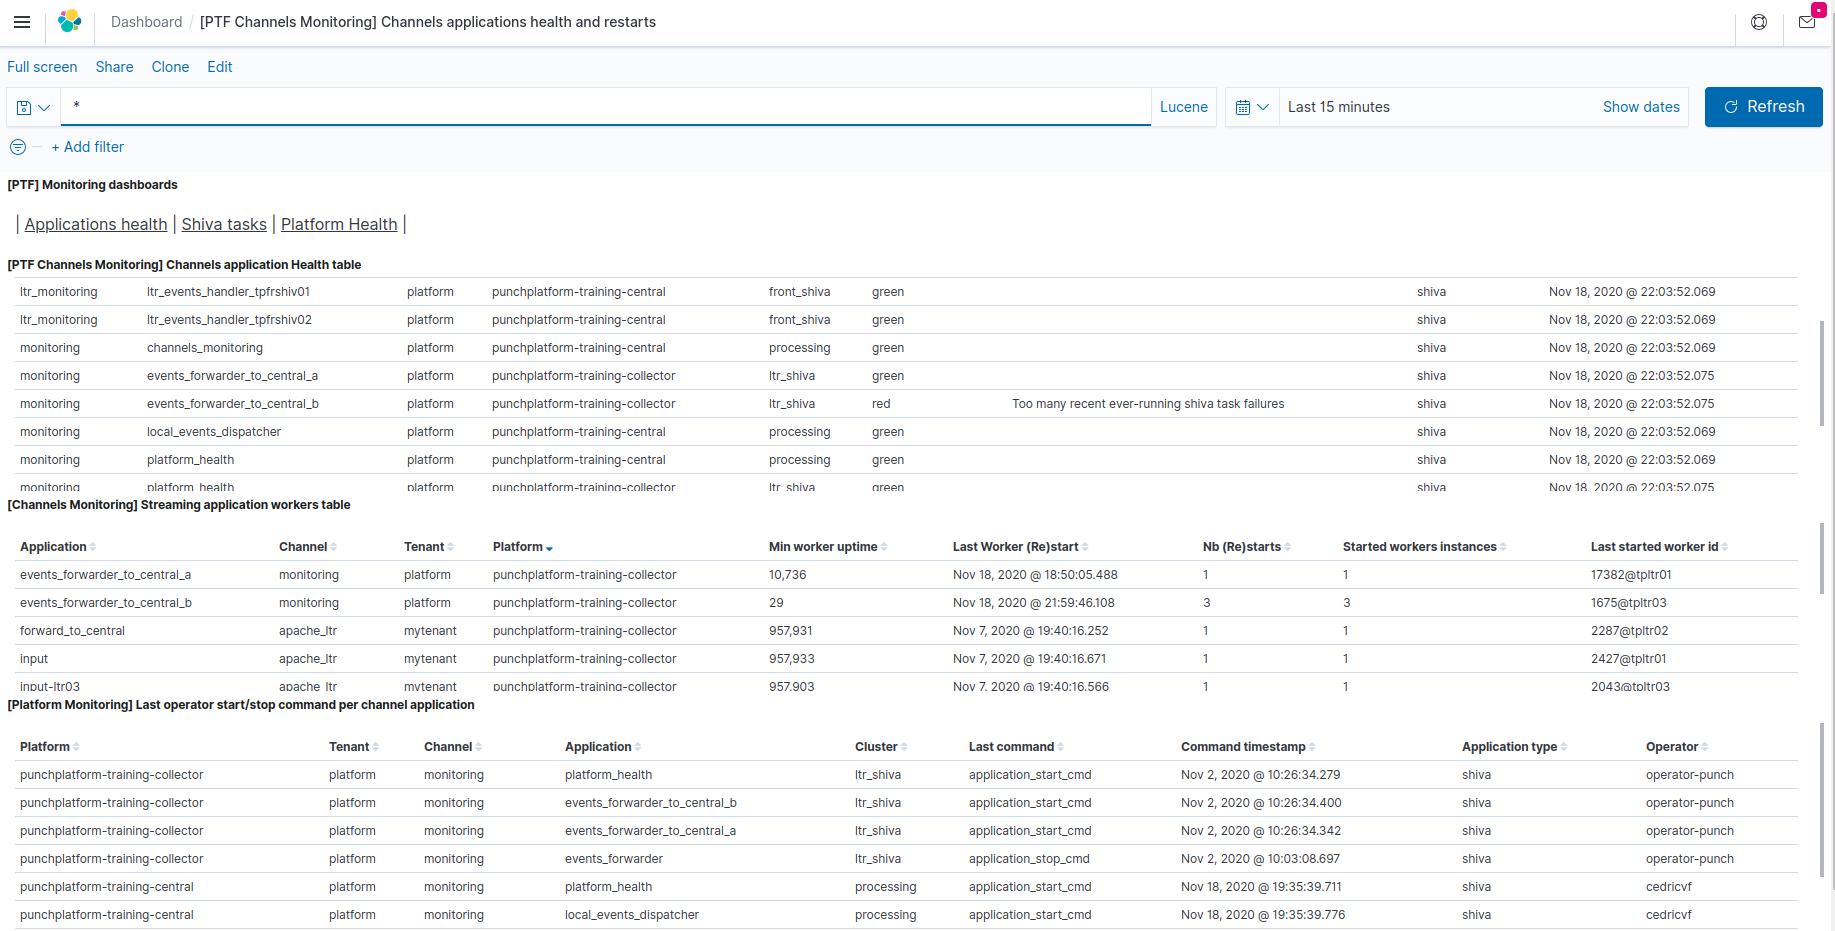
Once imported, this dashboard is named [PTF] Channels applications health and restarts in your Kibana.
This dashboard provides information about the operational status (started or not) and synthetic health of each channel application.
For streaming applications, it also provides location and uptime information useful to help troubleshoot applications that are supposed to be running, but are not providing the expected service (even if their technical status is green).
This dashboard is based on records of the "-channels-monitoring-" indices from the monitoring Elasticsearch instance, produced by the Channels monitoring task when configured for some tenants.
This dashboard can contain channels health information relative to channels of multiple platforms (e.g. the central platform providing the monitoring and kibana services, and additional remote platforms that are forwarding channels events and metrics, used locally to compute the remote application health)
This dashboard is made of the following views:
-
[PTF Channels Monitoring] Channels application Health table (top view)
This table provides the computed synthetic health level (green/yellow/red) of each channel application that has been started at some point in the past.
In addition, the
Alertsfield can provide error messages or information helping to clarify the reason for computed non-nominal health levels.If the last known operator command about an application is a stop, then this application is not currently monitored anymore, so the last known health level and alerts may be obsolete information (see
Monitoring timefield)Warning
Remember that channels monitoring tasks operate on a per-tenant basis. It means you only have synthetic application health for tenants that have this task defined and started.
-
[Channels Monitoring] Streaming application workers table (middle row view)
This table synthetises uptime metrics of storm-like applications (i.e. most often streaming applications):
 1
 2
 3
 4
 5
 6
 7
 8
 9
10
11
12
13
14
15
16
17
18
19
20
21
22
23
- the **Last Worker (Re)start** indicates the last known timestamp where one of the
  application workers started. If this is matching the operator commands (see bottom view), then it
  is normal.

  If this start time is more recent, it may imply that some instability or error was encountered,
  that resulted in the automatic crash/restart of the application. If this occurs repeatedly,
  please investigate using the application (shiva task or storm worker) logs.

- the **Started worker instances** should be equal to the configured numbers of "workers" in the punchlline (always 1 in shiva streaming applications). Otherwise
  this agains indicate that multiple starts of this application jvms have occurred over the selected
  time range. This may be normal if the operator has stopped/restarted the application during the
  selected time range.

- the **Min worker uptime** is useful to sort the table by showing on top the most recently
  (re)started application workers. If no operator action (start) is associated, these are
  the applications that are currently unstable (restarting on their own).

- the **Last Started worker id** provides indication of the shiva/storm node hostname and process number where is running
  the application worker that (re)started most recently among the application workers.
  This is useful for locating this worker hostname for local viewing of the logs if needed.
  Remember that for shiva-hosted applications, logs are usually collected and centralized in the
  monitoring instance of Elasticsearch, and can be viewed in
  [Shiva events dashboard](Punch_Platform_Monitoring_Dashboards.md#shiva_tasks_eventslogs_dashboard).
Warning
Because this view only shows last known alert messages, a component which is now healthy may still be displayed here, if the selected time range encompass a time when this component was indeed in non-nominal health status.
-
[Platform Monitoring] Last operator start/stop command per channel application
This table shows last operator event related to each application (starting or stopping it). These are taken from
platform-operator-logs-*indices.This table is useful to :
1
2
3
4
5
- find out which applications are currently submitted to the platform for execution, and which
  ones have been voluntarily stopped by an operator (for maintenance/change purposes). This avoids
  troubleshooting a channel or application that has in fact been not started.

- compare the application workers restarts (as indicated in the streaming applications view) and the actual operator stop/start actions/
It also provides identification (linux account named) of the operator that last stopped/started each application, and the time when this action occurred.
Hint
Note that to avoid false-alerts, synthetic health is only computed for application that are currently registered as started by an operator.
For stopped applications, the displayed synthetic health status will be last known before the application was stopped.
In addition, also to avoid false-alerts, synthetic health computation rules are more tolerant when an application was recently started.
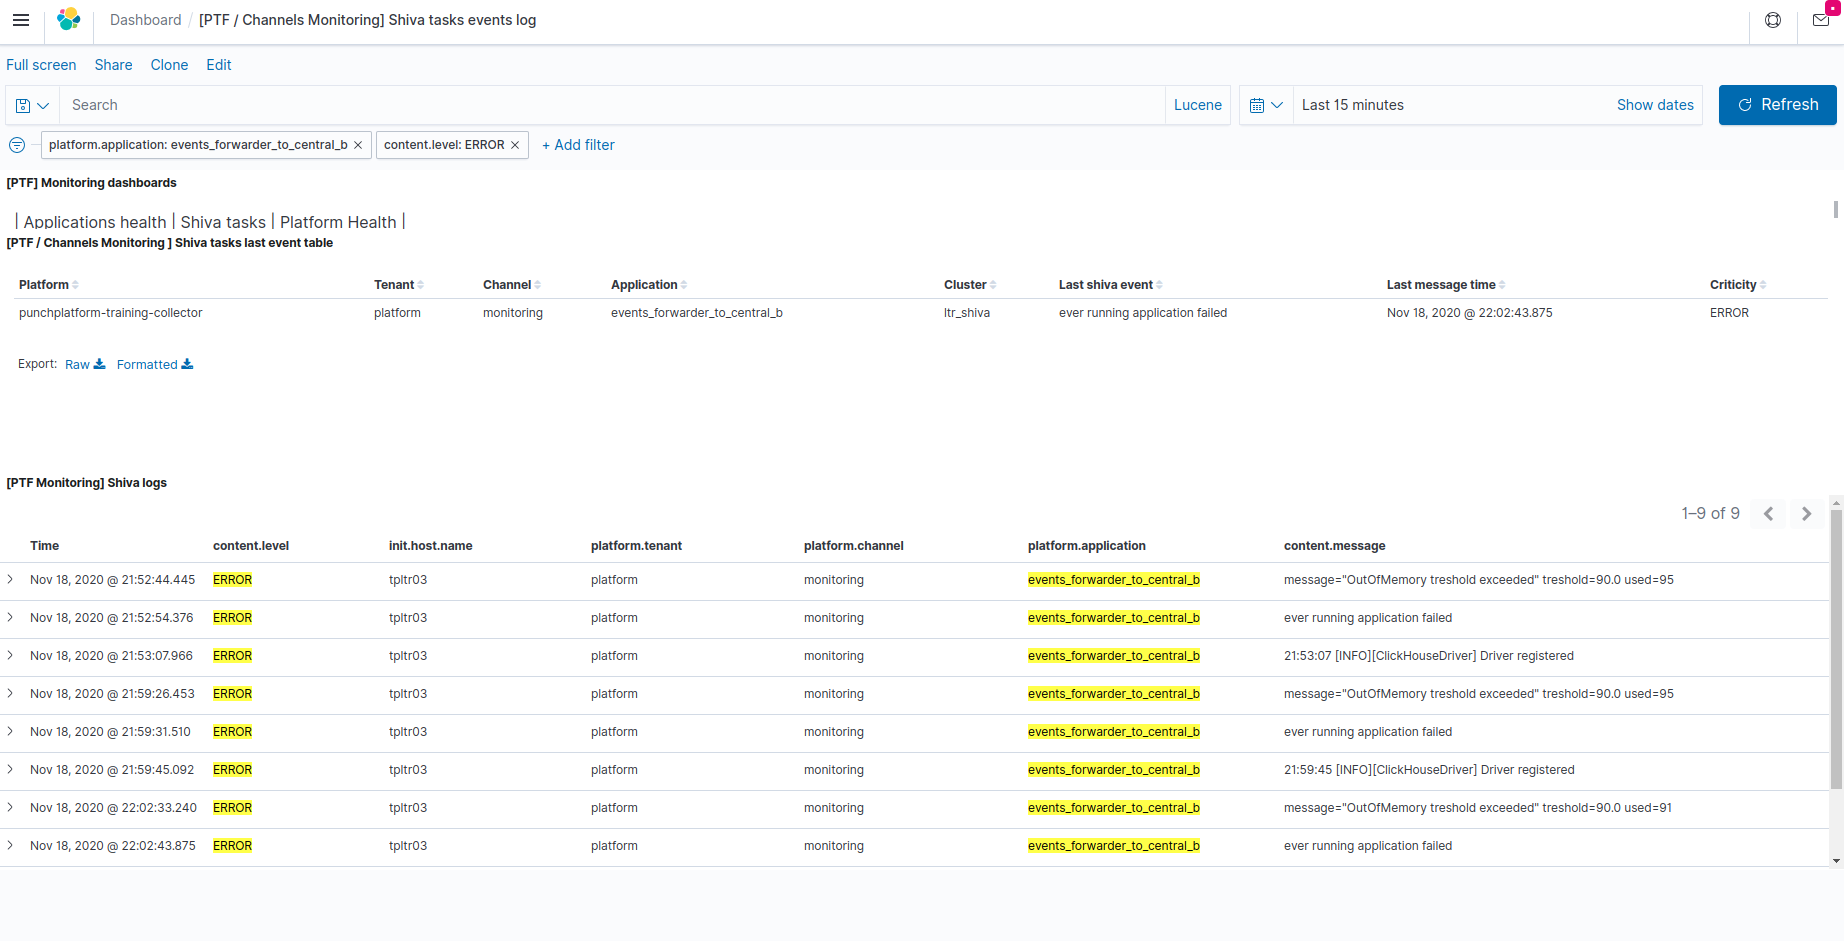
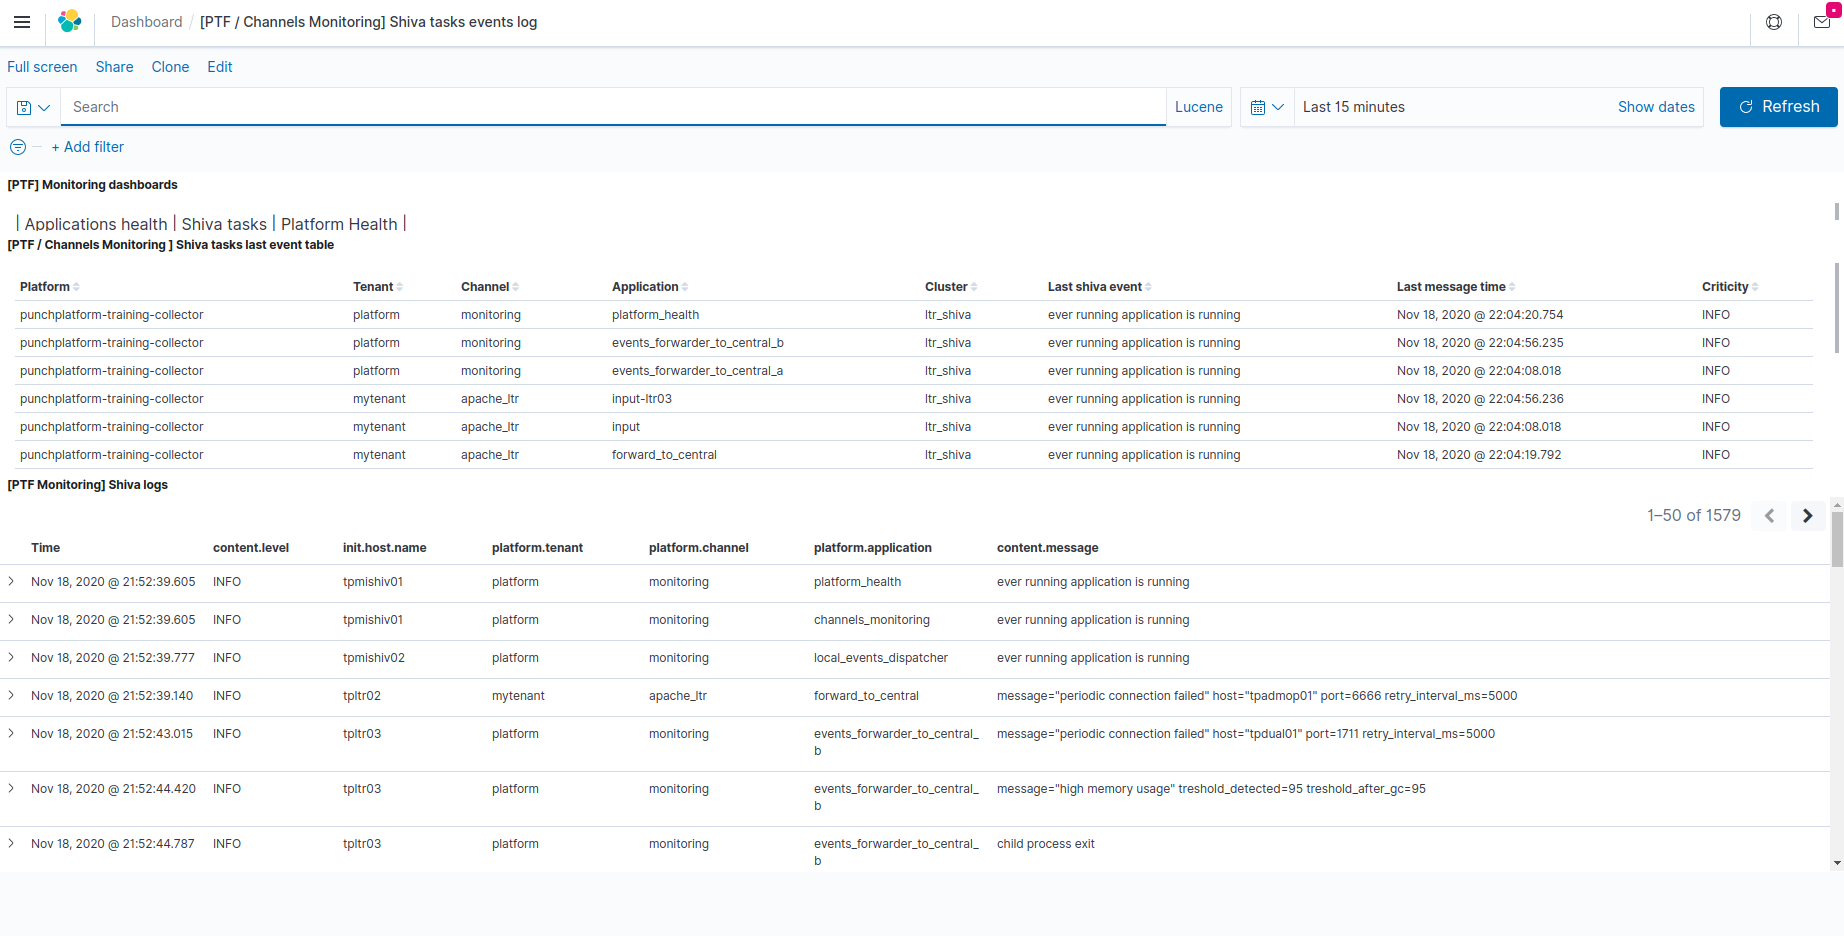
Shiva tasks events/logs dashboard
Once imported, this dashboard is named [PTF / Channels Monitoring] Shiva tasks events log in your Kibana.
This dashboard provides information about the last known monitoring state producted by Shiva clusters, about each application submitted to these Shiva clusters for execution.
It also provides a centralized view of the logs or output produced by these application into standard/error "virtual console" output streams.
This dashboard is based on records of the "platform-logs-*" indices from the monitoring Elasticsearch instance, produced by the Shiva runner nodes reporters, and centralized through Platform events centralization/dispatching configuration.
This dashboard is made of the following views:
-
[PTF / Channels Monitoring ] Shiva tasks last event table (top view)
This table provides the last shiva-cluster event registered about each shiva application.
-
For permanent applications that are expected to continue running for ever (e.g. streaming/storm-like applications, or plan applications), this can help confirm that the application is indeed running ('ever running application is running'), as opposed to being restarted, or beeing unscheduled (because of no allowed execution nodes available).
-
For periodic tasks (application with a 'cron pattern' specifying their start time, and expected to finish with an exit code once their job is done), the last event gives information about whether the task is currently running, or what was its last known result (success or failure), and the time it happened.
This is useful for example to know whether nightly housekeeping/purging of old data has run successfully.
Note
Although this last shiva event field is useful for knowing what has happened or is happening, remember that these records are also taken into account automatically by the Channels monitoring task when configured for some tenants.
So, you do not have to come daily and see this dashboard for supervising the correct execution status of your periodic tasks, as long as you've included in your supervision solution rules for periodically checking the channels health monitoring synthetic results through REST API Calls to the appropriate documents in the monitoring Elasticsearch instance,
-
-
[PTF Monitoring] Shiva logs (bottom view)
This view shows application output lines collected from the selected time range (and optionnally filtered application/tenant/channel...) collected by Shiva from standard/error output streams of running in shiva cluster(s).
This is useful for troubleshooting non-nominal behaviour of channels applications running under shiva monitoring.
The content.level field indicates whether the line was reported as an information or debug information (not related to any anomaly), or a warning or error message that may help troubleshooting of a failure condition. This may be useful to quickly find only non-nominal messages, by filtering out the information level.
The actual output line/event is provided in the content.message field.
Events can be viewed in more detailed by 'unfolding' them using the arrow to the left of each record. This can provide some additional information:
-
When information could be captured (e.g. for java-based applications), the logger class that generated the information is stored in content.loggerName field.
-
The shiva runner node that is/was running the application, and captured the log/event is identified by the init.host.name field that gives the runner hostname.
-