Punch application metrics monitoring dashboards
These standard Kibana dashboards are used to monitor the performance and errors indicators that are produced by Punch application nodes (see Storm-like application metrics.
How to import them ?
These dashboards are provided in the standard resources provided in the resources/kibana/dashboards subfolders of the deployment package:
-
the platform_monitoring/pp_shiva_and_applications_monitoring.ndjson file imports (among others) the Applications metrics generic browser dashboard
-
the applications_monitoring/applications_eps_rtt.ndjson file imports three dashboards targetting processing rates, latency and error:
- Applications Key metrics overview dashboard
- Applications EPS/Ack/Fail metrics drilldown dashboard
- Applications RTT/Processing time metrics drilldown dashboard
Important
These three dashboards were initially designed for development/testing environment, but can be used for other platforms.
Because they are 'troubleshooting' oriented, remember that if you need useful, business-level kpis (like Events Per Seconds cumulated over a full tenant, but considering only the collector site input application), it is usually needed for production purpose to build custom dashboards (e.g. it is not useful to sum up the input and indexing applications throughput when you want to know how many events your log management platform is handling ; usually you want to have one overall information per stage.)
These dashboards can be imported by using punchplatform-setup-kibana.sh (Please refer to post-deployment configuration documentation.
Applications metrics generic browser dashboard
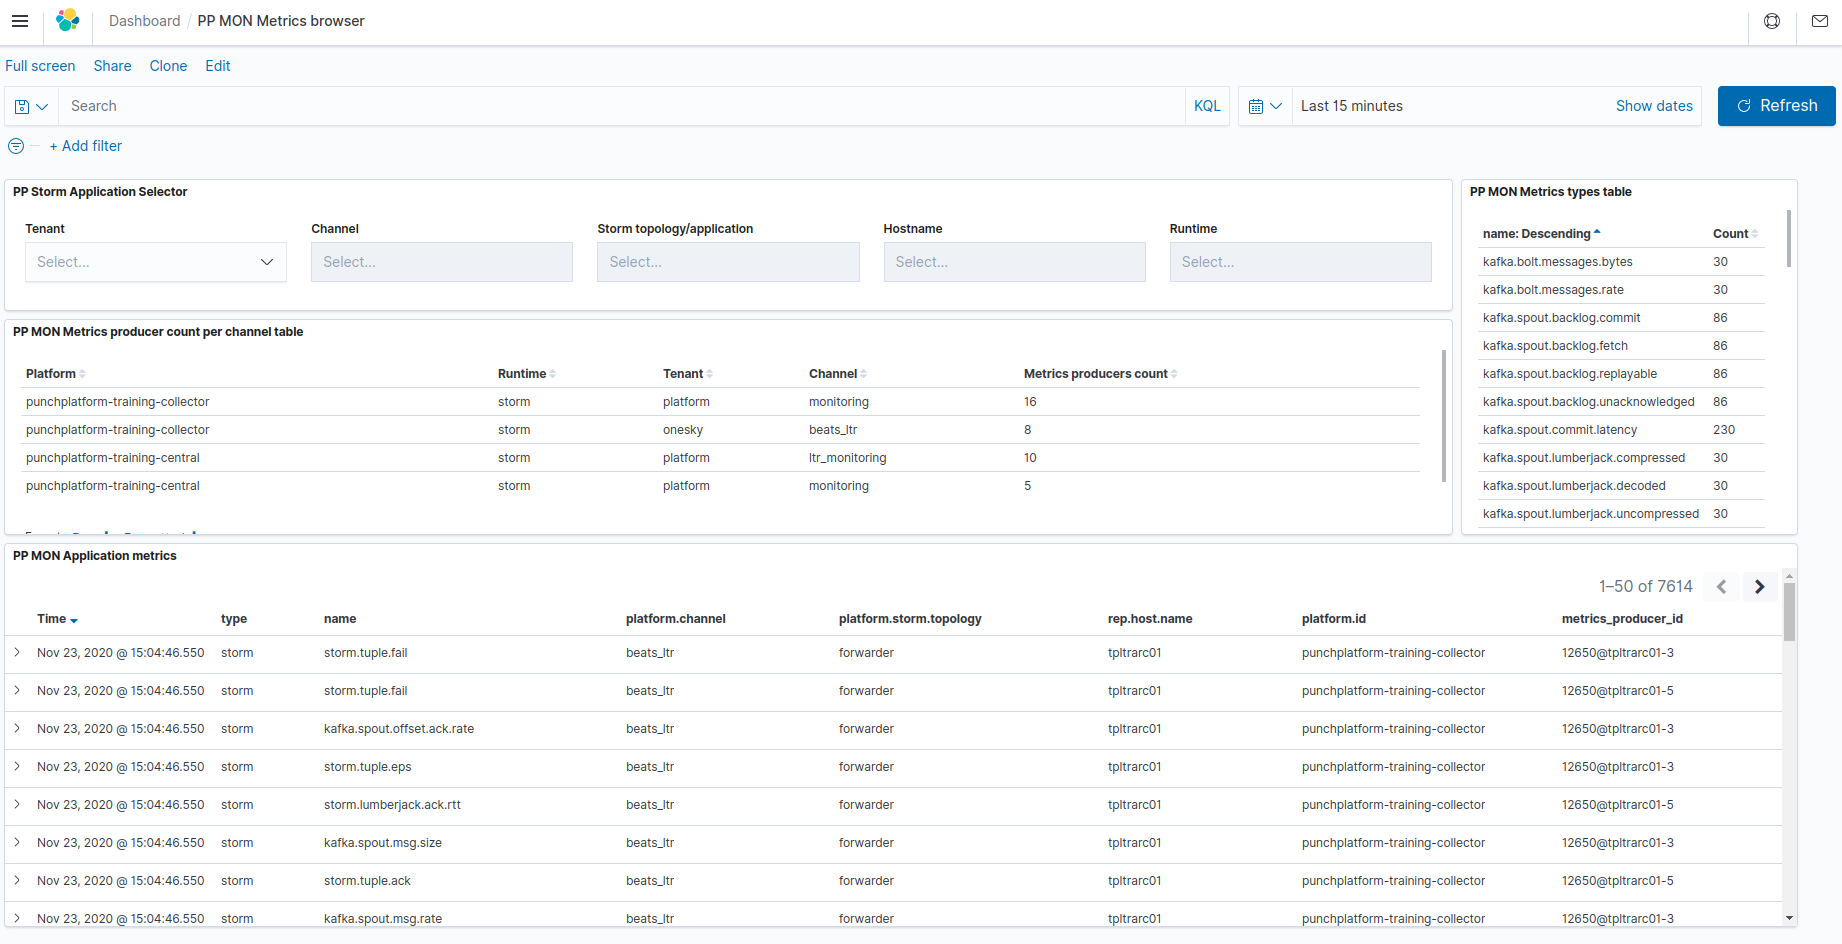
Once imported, this dashboard is named [PTF] Channels/applications monitoring Metrics browser in your Kibana.
This dashboard is used for selecting/viewing all metrics documents produced by Punch application nodes, whether on the local (central) punch platform actually holding the Elasticsearch database, or coming from remote punch platform sites that are forwarding their metrics to this local Elasticsearch.
The data is obtained by querying the "
The interpretation of "Health color" is given by the Platform monitoring rules documentation.
The name field is indicating the type of each metrics document.
The rep.host.name field is indicating the host on which the punch application that produced this metric is running.
The metrics_producer_id field can hold additional information about the linux process that contains the application, and help to discriminater between similar metrics source that can exist within the same punch application (multiple workers, multiple tasks with same component name...).
For details about existing metrics, please refer to the Storm-like application metrics documentation or to specific Punch nodes documentation in the Reference Guide.
The most used streaming/storm-like application metrics are :
-
kafka consumers(spouts) backlog metrics indicating the level of unprocessed data waiting in the kafka topics (at risk of loss, and indicating a processing lag or overload)
-
Ack/Fail rates that indicate the flow of documents processed (or unable to be processed) by the different application nodes. For this, have a look at Applications EPS/Ack/Fail metrics drilldown dashboard.
-
Latency/processing times of documents by the different application nodes. These can help troubleshoot which part of the channels/application is the bottlenck impacting the (lack of) performance. For this, have a look at Applications RTT/Processing time metrics drilldown dashboard.
Finding the metrics for your dashboard
When you want to design your own custom dashboard, you of course can find the metrics names
from the documentation, but you can also browse through the available metrics names
by using the top right pane in this dashboard (PP MON Metrics types table), optionnally
after filtering for your specific tenant/channel/application...
Applications Key metrics overview dashboard
Once imported, this dashboard is named [Applications Monitoring] Key metrics Overview Dashboard in your Kibana.
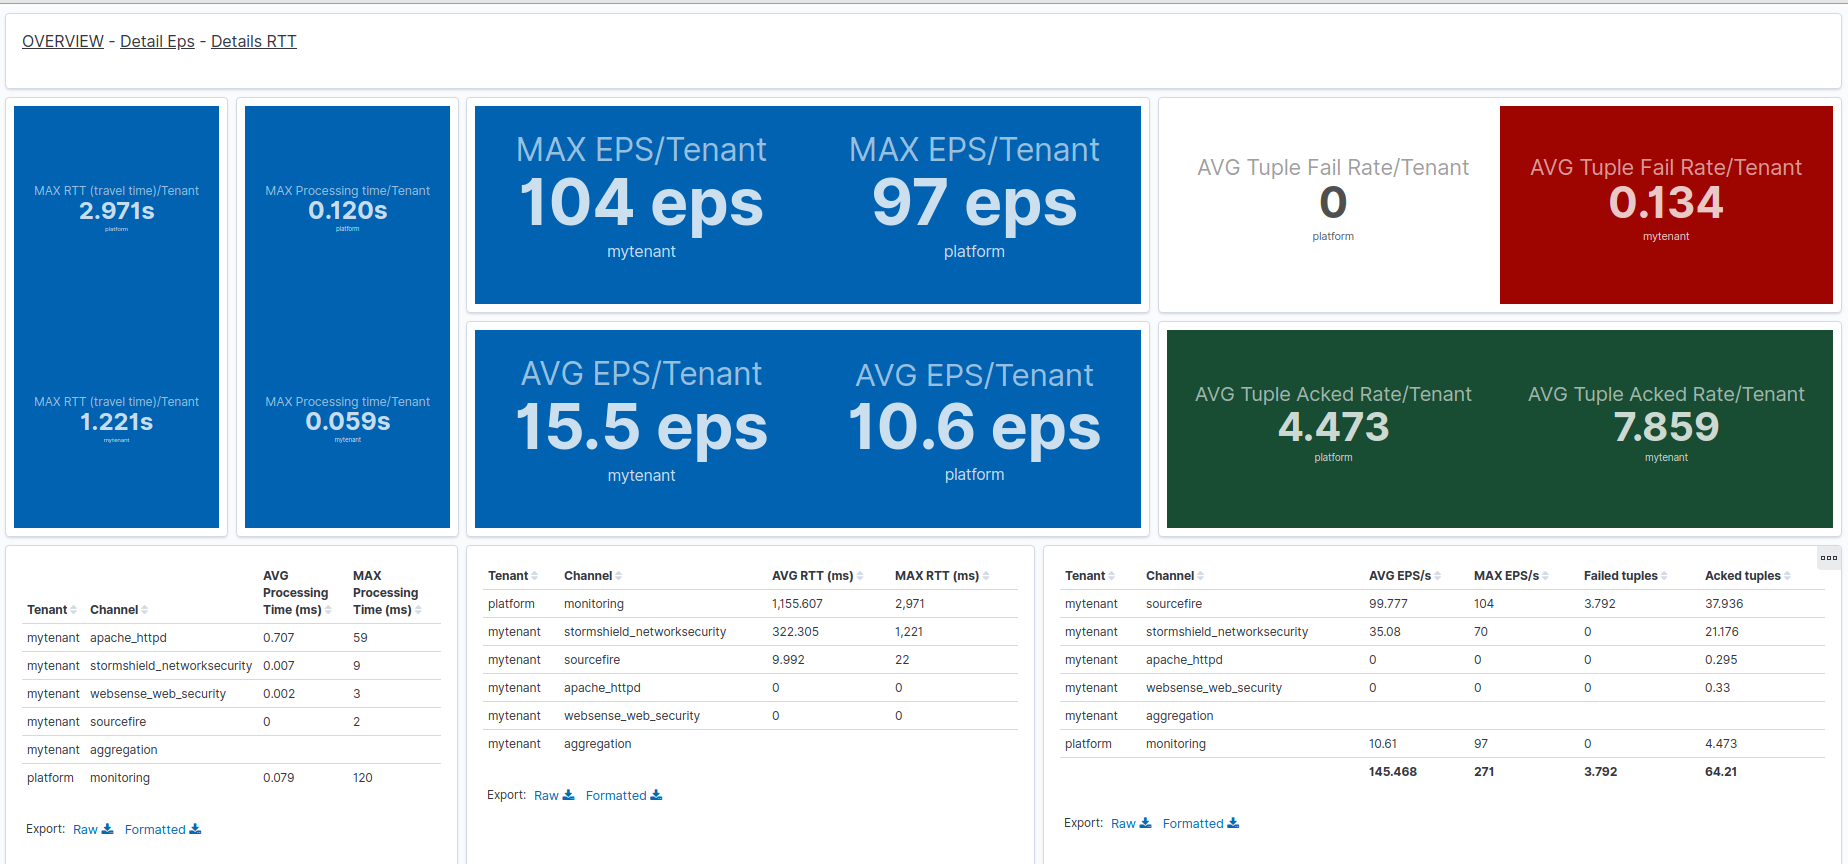
This dashboard provide an overview of standing out average/max of some important application nodes metrics:
-
Tuple ack is the number/rate of documents (logs, events...) successfully processed by the application
Each node of the application computes separately this metric for itself.
-
Tuple fail is the number/rate of documents that an application (component) was not able to process.
Usually, because failed documents are retried, this means this application is stuck and will not make any more progress in handling the data, until the failure condition has disappeared (e.g. network connection reestablished, target cluster repaired...).
In some cases (e.g. communication lines), failures are indicative only of a loss of performance, because after retry, the documents processing eventually succeeds (which can be seen through tuple acks and through kafka consumers backlog monitoring.)
Each node of the application computes separately this metric for itself.
-
EPS (Events Per Second) is an alternate metric measuring instantaneous/max througput values in input nodes (spouts).
Each input node of the application computes separately this metric for itself.
-
RTT (Round-trip time) provides measure (in seconds) between entry of a document by an input node of the application, and the acknowlegement (global success) of this document processing by the application.
Each input node of the application computes separately this metric for itself.
-
Processing Time provides measure (in seconds) between entry of a document inside a processing or output node and the acknowlegement (i.e. end of processing inside this node) of the tuple. Note that this does not include any processing time of this document by an other node of the application. for cumulating processing time and tuple pending time (waiting in queues) inside the application, see RTT metric.
An overview, not a business synthesis
This dashboard is useful to - detect quickly the "big things", e.g: * the highest RTT or processing time, which can identify a performance bottleneck or resources overload * the highest Tuple failures, which can identify an unbstability of communication or framework, or a stuck application - have the highest processing rate of a single channel (all stages considered)
BUT it is not providing detailed information of where these metrics are taken inside the given channel. For drill down, it is necessary to use on of the more precise dashboards, described in the following chapters of this page.
Additionally, although you can filter by tenant or channel, the displayed metrics in case of such filtering will not be cumulated over all application components within such a selection. (therefore not providing the total EPS or Ack rate of a whole channel or tenant). For such business-specific need, custom dashboards have to be designed by the solution integrator.
Applications Eps/Ack/Fails metrics dashboard
Once imported, this dashboard is named [Applications Monitoring] EPS Ack Fail Rates Dashboard in your Kibana.
This dashboard allows to view fine grained "rates" (EPS/Doc Processing Ack rate/Fail rate) at node level inside applications.
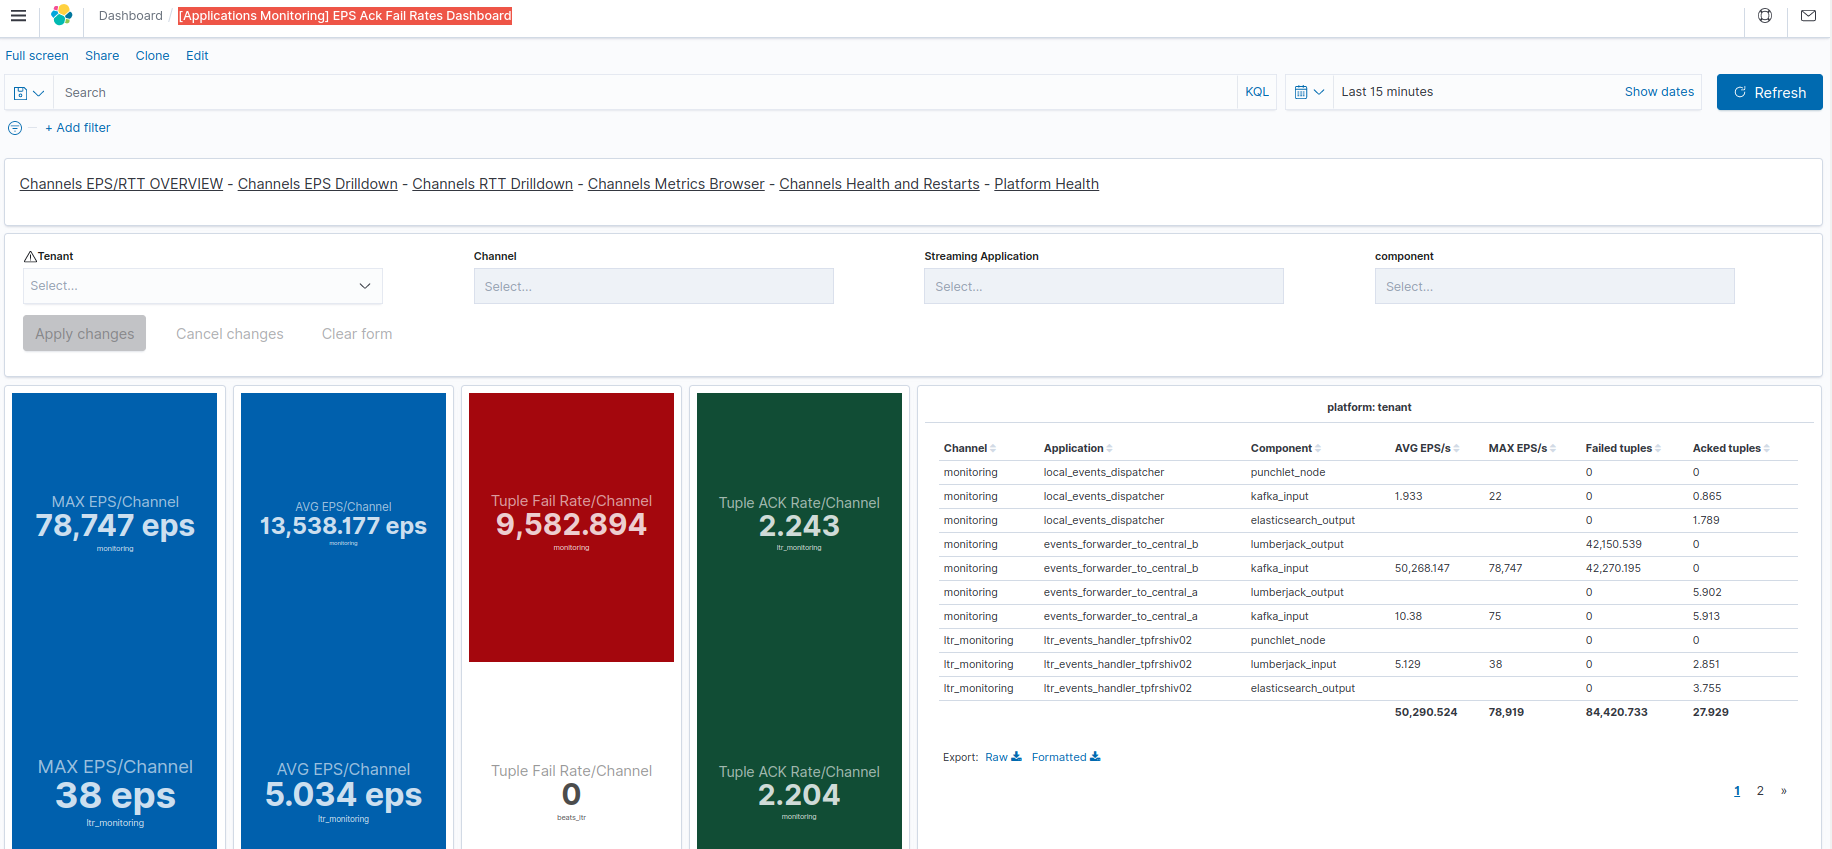
See Applications Key metrics overview dashboard for an introduction on the EPS/Ack/Fails metrics and introduction of what 'failures' may mean.
Warning
Although it is possible to see individual max/average EPS of a given channel application component, the displayed metrics are not cumulated.
Therefore, if multiple components are selected inside a channel or application, then the displayed events rates are the overall max and everage (therefore not the total EPS or Ack rate of a whole channel or tenant).
Remember in particular that even a single application may have multiple instances (executors) of a given node which may lead to multiple distinct metrics to take into account (and again, not summed here)
Applications RTT/Processing time performance metrics dashboard
Once imported, this dashboard is named [Applications Monitoring] RTT/Processing time Dashboard in your Kibana.
This dashboard allows to view fine grained "latency/consumption" (RTT/Processing time) metrics at node level inside applications.
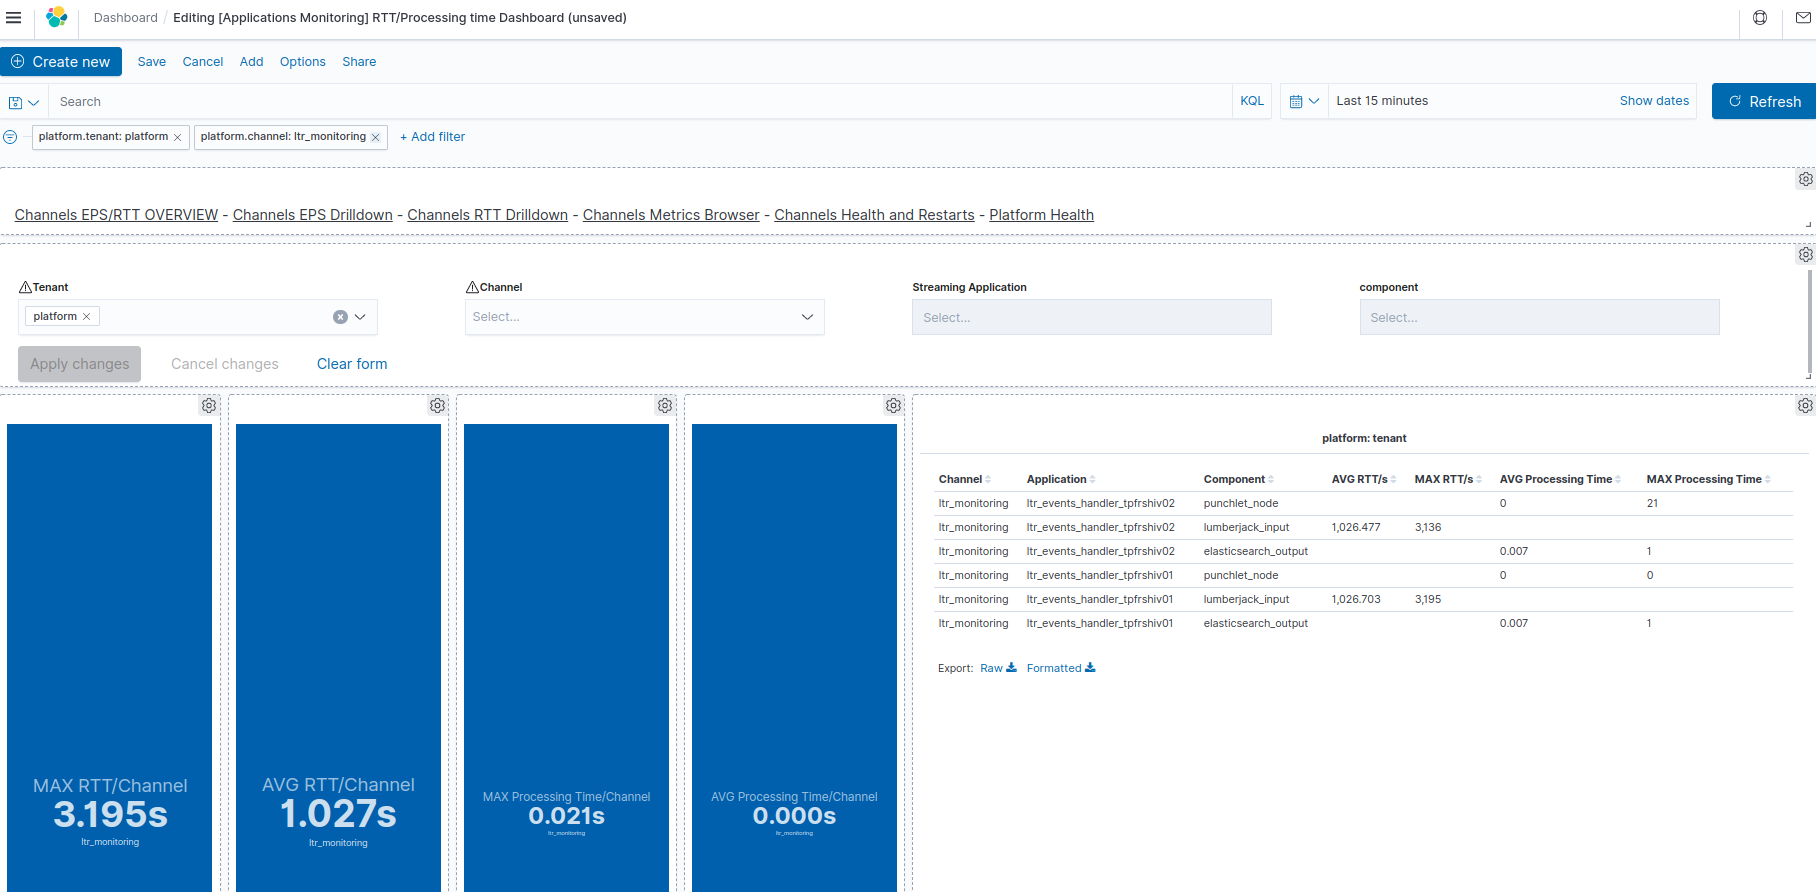
See Applications Key metrics overview dashboard for an introduction on the RTT/Processing time metrics.
Troubleshooting Hints in case of high RTT/processing time
-
When an input node shows a high RTT, you need to check the processing time of following nodes in the same application to understand which stage in the application is most contributing to the overall time.
-
If an input node shows a high RTT, but none of the following nodes has a high processing time this may mean that the documents are staying too long in internal queue, and not actually while being processed. This may mean that the allowed number of documents/tuples inside the application (max.spout.pending) is too high as compared with the throughput capacity of the application. You may want to reduce this allowed number of in progress documents (to avoid unnecessary RAM usage, and risks of tuple timeout) OR increase the executors count for CPU-intensive nodes like punch nodes.
-
Note that for output nodes, 'processing time' may include all the latency for communicating to a target for sending the output document, and the response-time of the remote service.
Warning
Although it is possible to see individual max/average RTT/Processing time of a given channel application component, the displayed metrics are not cumulated.
Therefore, if multiple components are selected inside a channel or application, then the displayed events rates are the overall max and everage .
Remember in particular that even a single application may have multiple instances (executors) of a given node which may lead to multiple distinct metrics to take into account (and again, not summed here)