Metrics in Apache Storm
By Technologies
Storm Tuples
The tuples metrics are published by all the existing input nodes.
Metric context: default, storm component
-
storm.tuple.fail[Meter] Tuples/secondfailed tuples rate
-
storm.tuple.ack[Meter] Tuples/secondacked Tuples rate
-
storm.tuple.rtt[Histogram] millisecondsTuple traversal time
-
storm.tuple.pending[Counter] Tuplespending Tuples
-
storm.tuple.length[Histogram] bytesaverage Tuple length
-
storm.tuple.eps[TimeValue] Tuples/second'max', eps max on 500ms on eps calculated during 30s (default values)
Storm Latency
If an input node has its latency feature activated, all the subsequent nodes will publish this metric. Refer to the input nodes common configuration to see how it works.
Metric context: default, storm component
storm.latency[Latency] millisecondsCompute the time elapsed from the initial spout generation (
storm.latency.start) to the current spout or bolt. This difference is given in milliseconds in the fieldstorm.latency.diff
Storm Topology
These metrics are related to Storm workers which means that any running topology will publish them.
Metric context: default
-
storm.worker.uptime[Counter] secondindicate if the process is still alive
-
storm.worker.memory[Gauge] bytesthe memory consumed by the worker topology
Netty commons
These metrics are published by all socket-related nodes that rely on the Netty library (i.e. syslog_input, lumberjack_input, ...).
Metric context: default, storm component, netty
-
netty.app.recv[Counter] bytesdecoded bytes received
-
netty.raw.recv[Counter] bytesraw bytes received
-
netty.app.sent[Counter] bytesdecoded bytes sent
-
netty.raw.sent[Counter] bytesraw bytes sent
-
netty.compression.recv.ratio[Gauge] ratiocompression ratio of received data
-
netty.compression.sent.ratio[Gauge] ratiocompression ratio of sent data
Kafka Spout
The Kafka Input publishes several metrics, some of them related to the various backlogs. Here is a quick view of the three published backlogs.
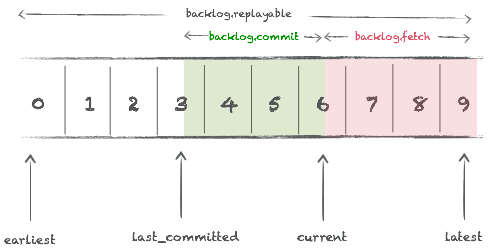
The so called fetch backlog (backlog.fetch) is the one
that tells you if your consumer (aka spout) is lagging behind your
producer(s). The replayable backlog tells you how many message you can
potentially replay, it also has an important operational meaning.
The commit backlog is more informational, it gives you an idea of how many message you will replay should you restart a topology.
Info
the metrics published by the spout stop being published (of course) whenever you stop your topology. However the punchplatform also publishes the lag of all known topic/partitions for all defined consumer groups from an external monitoring service, so that you never loose visibility on your backlogs.
Metrics context: default, storm component, kafka, kafka partition, kafka consumer
Metrics published:
-
kafka.spout.backlog.commit[Gauge] longthe commit backlog expresses the number of message that would be re-read in case of restart. This measure the gap between the latest saved committed offset and the latest offset. This metric is meaningful only with the "last_committed" strategy.
-
kafka.spout.backlog.fetch[Gauge] longthe backlog expressed in number of message that be re-read in case of restart. This measure the gap between the latest saved committed offset and the latest offset.
-
kafka.spout.backlog.replayable[Gauge] longthe backlog expressed in greatest number of message that can be possibly reread from this partition. This is an indication of the message you can possibly replay from Kafka before they are definitively discarded.
-
kafka.spout.commit.latency[Timer] msthe time it takes to perform an offset commit for this partition. This gives an idea of the Kafka broker speed of handling commits.
-
kafka.spout.msg.rate[Meter] per partition read/secthis rate measure the number of effective read from a partition
-
kafka.spout.msg.size[Histogram] sizethe average message size
-
kafka.spout.offset.ack.rate[Meter] acks/secthe rate of offset acknowledgement
-
kafka.spout.offset.fail.rate[Meter] acks/secthe rate of offset failure
-
kafka.spout.offset.earliest[Gauge] longthe earliest offset for this partition
-
kafka.spout.offset.latest[Gauge] longthe latest offset for this partition
-
kafka.spout.offset.committed[Gauge] longthe committed offset for this partition
-
kafka.spout.time.current[Gauge] longthe time associated to the currently read message. That value is a milliseconds epoch unix timestamp.
-
kafka.spout.time.delay[Gauge] longthe time difference in milliseconds between now and
time.current. Visualising this gauge gives you an easy view of how late in time your consumer is. -
kafka.spout.lumberjack.compressedrefer to Lumberjack Spout
-
kafka.spout.lumberjack.decodedrefer to Lumberjack Spout
-
kafka.spout.lumberjack.uncompressedrefer to Lumberjack Spout
Note
all these metrics are per topic, per partition and per consumer group.
Syslog Input
Metric context: default, storm component, netty
-
syslog.server.blocked_by_queue_full_ns[Meter] nanosecondstime elapsed in reception thread while waiting due to input queue full (may cause message loss if UDP)
-
syslog.server.udp.packet.drops.count[Count] Number of UDP packet dropsnumber of UDP packet which have been dropped
In addition, the Syslog Spout also produces Common Netty Metrics.
File Input
The file_spout only publishes the common metrics coming from topology
and tuples.
Lumberjack Input
Metric context: default, storm component, netty
-
netty.lumberjack.compressed[Counter] bytescompressed bytes count
-
netty.lumberjack.uncompressed[Counter] bytesuncompressed bytes
-
netty.lumberjack.decoded[Counter] bytesapplication bytes count
In addition, the Lumberjack Spout also produces Common Netty Metrics.
Http Input
The http_spout only publishes the common metrics coming from topology,
tuples and netty.
Kafka Output
Metric context: default, storm component, kafka
-
kafka.bolt.messages.bytes[Counter] bytesaverage message size
-
kafka.bolt.messages.batched[Histogram] messagesaverage Tuple length
-
kafka.bolt.messages.rate[Meter] message/seconddecoded bytes received
Syslog Output
The syslog_spout only publishes the common metrics coming from topology,
tuples and netty.
Lumberjack Output
Metric context: default, storm component, netty
-
netty.lumberjack.compressed[Counter] bytescompressed bytes count
-
netty.lumberjack.decoded[Counter] bytesapplication bytes count
-
netty.lumberjack.uncompressed[Counter] bytesuncompressed bytes
Archive Processor Bolt
Metric context: default, storm component, ceph, ceph partition
When "write_to_objects_storage" publication is activated, the Archive processor Bolt publishes the following metrics :
-
ceph.cluster.kbytes.used[Gauge] instant kilobytes countstorage space used by the cluster (including management data)
-
ceph.cluster.kbytes.free[Gauge] instant kilobytes countunused storage space available for the cluster
-
ceph.cluster.objects.stored[Gauge] instant countnumber of objects currently stored in the cluster
-
ceph.pool.kbytes.used[Gauge] instant kiloBytes countstorage space used specifically by this object pool in the cluster
-
ceph.pool.objects.stored[Gauge] instant countnumber of objects currently stored in the object pool in the cluster
-
ceph.pool.objects.degraded[Gauge] instant countnumber of objects with missing replica
-
ceph.pool.objects.unfound[Gauge] instant countnumber of objects with unknown placement
-
ceph.pool.objects.missingonprimary[Gauge] instant countnumber of objects missing in primary
-
ceph.partition.objects.stored[Gauge] instant countnumber of objects currently stored in the partition of the topic
-
ceph.partition.tuples.stored[Gauge] instant countnumber of tuples currently stored in the partition of the topic
-
ceph.partition.bytes.stored[Gauge] instant bytes countnumber of bytes currently stored in the partition of the topic
-
ceph.partition.uncompressed.bytes.stored[Gauge] instant bytes countnumber of bytes stored in the partition of the topic (before compression)
-
ceph.partition.objects.written[Meter] number of objectsnumber and rate of objects written in the topic
-
ceph.partition.tuples.written[Meter] number of tuples(documents or logs)number and rate of tuples written in the topic
-
ceph.partition.bytes.written[Meter] number of bytesnumber of bytes written in the partition of the topic (and rate)
-
ceph.partition.uncompressed.bytes.written[Meter] number of bytesnumber of bytes written in the partition of the topic and rate (before compression)
Elasticsearch Output
Metric context: default, storm component
-
storm.documents.indexation.rate[Meter] integernumber of document cumulate in bulk request
-
storm.errors.indexation.rate[Meter] integernumber of error cumulate in bulk request
Filter Node
Metric context: default, storm component
-
drop.rate[Meter] integerdrop rate of filtered logs
-
storm.tuple.emit[Meter] tuples/secondemitted tuples
-
storm.tuple.eps[TimeValue] tuples/second"max", eps max on 500ms on eps calculated during 30s (default values)
By Context
All above metrics are enriched in Elasticsearch backend with the following tags subfields depending on the context level :
Default context
-
name(string)The metrics name identifier
-
type(string)Define the metrics related technology. In that case, its value is always set to
"storm". -
rep.host.name(string)The local hostname of the server running the storm component
-
metrics_producer_idA unique identifier of the metrics producer context. This can be used to group metrics in buckets in Kibana dashboard without mixing metrics related to different execution components, without having to group my multiple keys (tenant, id, component_name, kafka topic, kafka partition, task_id...) -
platform.id(string)The logical identifier of the containing punchplatform. This is the same as the
metrics root prefix used for ES back end. It is used to differentiate metrics produced by multiple PunchPlatform clusters sharing a same metrics backend. -
platform.tenant(string)The name or codename of the tenant, as configured in the channel and topology configuration files
-
platform.channel(string)The name of the logs channel, as configured in the channel and topology configuration files
-
platform.storm.container_id(string)The logical identifier of the containing storm cluster, as listed in the Punchplatform.properties file for topologies started in a cluster, or "local" for topologies started in local mode in a single process.
-
platform.storm.topology(string)The logical name of the topology, as it appears in the topology json configuration file. This is not the complete name used by STORM, which includes a timestamping
added at channel/topology initial start time and a unique instance identifier.
Storm Component Context
-
platform.storm.component.name(string)The logical name of the storm component, as it appears in the
storm_settings.componentfield of the spout/bolt subsection of the
topology json configuration file. -
platform.storm.component.type(string)The spout/bolt type as stated in the "type" field of this component in the topology json configuration file
-
platform.storm.component.task_id(integer)The internal storm component number inside the topology. This is useful to distinguish between spout/bolts instances with the same component_id, that are executed when an storm_settings.executors higher than 1 has been configured in this storm component subsection of the topology json configuration file
Kafka Context
-
kafka.cluster(string)the kafka brokers cluster id as configured in punchplatform.properties
-
kafka.topic(string)the topic name as listed in the topology settings
Kafka Partition Context
Extends Kafka context
kafka.partition(integer)the partition number
Kafka Partition Consumer Context
Extends Kafka Partition Context
consumer.id(string)the kafka id of consumer : storm topology id, name of storm component, task id
Elasticsearch Context
-
elasticsearch.cluster(string)the name of the elasticsearch cluster from which documents are extracted
-
elasticsearch.index(string)the name of the elasticsearch index from which documents are extracted
Ceph Context
ceph.pool(string)the name of the CEPH object pool
Ceph Partition Context
-
ceph.topic(string)the name of the topic
-
ceph.partition(integer)the partition id within the topic
Netty Context
-
netty.target.host(string)The hostname or address of the host to which data is sent.
-
netty.target.port(string)The udp or tcp target port to which data is sent.
-
netty.target.protocol(string)Used communication protocol.