Monitoring
Abstract
The elastic stack is now widely used for monitoring use cases. In this short chapter we explain through a simple example why monitoring is not easy, and how you can leverage the punch to achieve powerful, simple and robust end-to-end applicative monitoring.
Problem Statement
Understanding why monitoring is difficult is easier with an example. Let us take the punch itself as an example. For example the standalone release you (hopefully) downloaded and run on your laptop.
The standalone ships with an example tenant that consists in several channels, each running one or several applications. Some are ever-running streaming apps, others are periodically executed. All these should be monitored so that you receive the right alarms, not tons of false-positive alarms. That is the problem we want to solve.
Monitoring channels on a punchplatform is made easy thanks to the many monitoring metrics published by punchlines, plans, shiva and more generally by all punch components. This said, deriving generic monitoring rules that apply to all (and in particular your) platform is not that simple. Two examples will make this clear.
Monitoring Process Restart
Consider first the process uptime metric. This metric lets you detect that one of your ever-running application has failed. An ever-running application is typically a ingestion punchline in charge of collecting, parsing and/or indexing your data into elasticsearch. You do not expect these to ever fail. Hence, watching the punch uptime metric can be used to throw an alert and trigger an investigation.
Monitoring Data Transport Failures
Consider now a second useful metric, the rates of data acknowledgments and failures. These two metrics are published by streaming punchlines. Basically if all the data is acknowledged, everything is running fine. If however you have some failures, it indicates that something went wrong:
- elasticsearch refused some requests
- kafka was not responding, maybe because of zookeeper
- a network outage occured
- a server or vm crashed in a distributed (storm) punchline
- etc..
Then What ?
Our retex helping customers dealing with monitoring large scale distributed platforms is as follows: it is very difficult to define generic monitoring rules that apply to all platforms. Detecting process restart or a rate of data failure look like a good idea for most platforms.
In fact not, failures can be harmless because some of your networks have stability issues. Of course it would be better to fix or improve your network, but having constant false positive alarms is not the way to go. If you have false-positive alarms, you will soon stop considering all your alarms. And the day you have a serious incident you will miss it.
For that reason the punch monitoring approach is different. The punch focuses on publishing many useful metrics. These are normalised and enriched so that you always know from which tenant, channel, application or component the metric is about. From there you have Kibana helping you to design the dashboards your application need. And if/when you know what are the indicator(s) that you need to monitor in order to raise alarms, then the punch gives you powerful means to do just that.
Example
Checkout the standalone 'applicative_monitoring' example.
The mytenant tenant includes an aggregation application, defined as part of the 'aggregation' channel. That application periodically aggregates the data indexed by other channels to compute some sums.
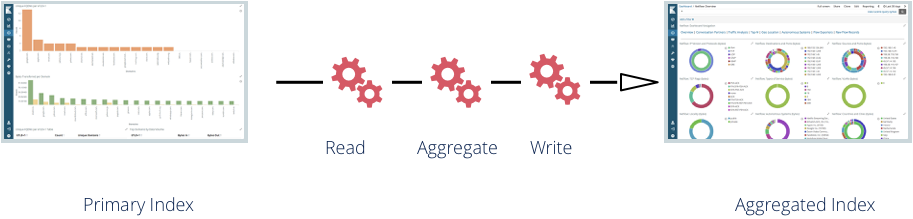
Monitoring that channel is a good idea, because if you can check that that one is working fine, it means the others too. Better monitoring these kinds of high level applications than monitoring each finer grain application.
To do that a punch plan is used to periodically (every 5 mn) check that the expected sums are indeed published. More precisely we check if:
- If the data is stored in the aggregation index
- If the doc_count is not null
In turn the applicative monitoring punchline publishes a small report data (ok or ko) in a platform applicative
monitoring index (platform-applicative-monitoring). Once done, you will be able to poll that index from your
monitoring component (say nagios or cacti) or instead decide to generate an alert and send something to someone
(email, jira notification, webhook, whatever).
Refer to the Getting Started guide for details.