Punch Components
This tracks provides insights on deployment andclustering constraints, data lifecycle, High-Availability and Data Replication principles, and Scalability for the main punch components.
Know their place
Before going to specifics, please review and ensure you are comfortable with:
- the Punch Components,
- their role in [the overall picture] and in relation with all Punch Enablers
Key roles
- Indexation/Database back ends are: Elasticsearch, Clickhouse
- Long-term (object oriented) storage back-end are file-system (local or NFS), S3-compatible object storage (S3 API-complient storage appliances, Minio distributed software storage array, S3 API-compliant clouds ), or Ceph distributed resilient highly scalable objects storage cluster
- Short-term storage/Messenging/Transport means are Kafka topics and inter-site lumberjack communication
- Streaming-oriented processing engine is Storm
- High memory aggregation/computation engine is Spark.
- Alerting/Aggregating rules engines are Elastalert and Siddhi
- Lightweight Generic distributed scheduler/manager for any kind of tasks (streaming, batch, aggregation, alerter...) is Punchplatform Shiva.
- Dashboarding/Visualization front-ends are Kibana (fully integrated), Grafana (compatible but not deployed by punch), Superset (compatible but not deployed by punch)
Apache Zookeeper
The big picture
Zookeeper is a java-based 'basement' component not directly used by the user or punchlines. It is critical for internal states/cluster management in Kafka and Storm.
Behaving like a kind of small but very resilient distributed file system, its cluster of nodes
- stores very little quantities of information (like cluster nodes status), providing atomic read/write
- provides added value services much-helping applications cluster management :
- ephemeral file nodes that automatically disappear from the cluster space in case of disconnection of the application node that created it)
- features helping 'leaders' election (atomic 'create file if not exist' operation for example)
- protects the application that relies on it against risks of "split-brain" in the cluster in case of network partition between application server sets.
It is important to know Zookeeper as it leads to deployment constraints for high-availability of Kafka or Storm:
High-Availability and Data protection
Deploying an odd (2*n + 1) number of Zookeeper servers will guarantee:
- Zookeeper cluster availability up to the loss or network disconnection of
nzookeeper nodes. - Data consistency protection (written nodes, like Kafka topics status and offsets) against the loss of
nzookeeper nodes (the data is fully replicated on all of the nodes. happily, this data is usually small!)
The constraints / needed resources
- To ensure anti-split-brain guarantee, Zookeeper needs at least 3 deployed servers, because it will require strict majority in its internal vote to find out which 'half' of a partitioned cluster is indeed alive.
- To ensure high-availability of Zookeeper, its server nodes HAVE to be hosted on separate PHYSICAL units. For example, hosting 2 Zookeeper nodes on a physical server, and a 3rd one on an other physical server is failing, HA-wise: if the server hosting the 2 Zookeeper nodes crashes, then the Zookeeper cluster is down !
- To ensure internal majority voting/consistent data replication, Zookeeper needs consistent time
base between the server, and a not-too-high latency (usually not multi-sites ).
Zookeeper needs usually not much resources for Punch use cases as compared to other higher-level framework components:
- very few CPU (fraction of 1 CPU per node)
- typical RAM need of 500MB for the lightweight platforms handling a few KEPS to 1.5MB for the heavy duty punch deployments handling over 50 KEPS (influenced by the number of client applications like storm nodes and storm-hosted processes)
- Potentially a high count of concurrently opened and maintained network connections (one per client application process). This may need tuning if you are using storm-based punchlines in great number (more than 150 processes). A restriction is configured in your linux OS settings.
Caveat: JVM collapse syndrome
It has been known that due to increase of zookeeper client processes (storm-hosted punchlines), the RAM consumption has raised enough so as to almost exhaust the allocated zookeeper cluster JVM.
As for other JVMs, this may lead to a too-frequent execution of the Java Garbage Collection mechanism trying to free some unused memory. In turn this can consume a lot of CPU and reduce Zookeeper effective bandwidth, impacting potentially all the platform services (through Kafka and Storm frameworks).
By integration-testing the resources consumption (inside the Zookeeper JVM) with 'jstat' tool during a heavy load (simulation) of the platform, you can confirm your allocation is sufficient.
Although not really data-intensive, Zookeeper latency may be impacted by low performance of the local filesystem (iowaits), as it is in the way of data-consistent writes in the cluster.
Important
Because Zookeeper is key for Kafka to know where its data are, and where the consumers are currently reading from, having a full Zookeeper filesystem on enough nodes can lead to a Zookeeper data inconsistency or loss, that can lead up to a full loss of Kafka-stored queues.
For this reason, whenever Zookeeper is installed on a same operating system as an other data-storing application (like Kafka), it is advised to have a small dedicated partition for zookeeper data.
Scalability
Although 3 nodes are usually enough for most use-cases (say up to roughly 100-200 client processes), in case of many zookeeper clients (often, storm-based punchlines processes), it may be fit to have 5 nodes. Clients will load-balance their connection, data synchronization without any sharding logic inside the Zookeeper cluster prevents actually linear scaling. This only avoids connection quota issues on the nodes, and also increases overall resilience of the cluster.
It is not possible to hot-plug additional Zookeeper nodes, as all of them have to know each-other by static configuration. Extending a cluster implies a full restart of the cluster.
It is also often possible to avoid or delay a Zookeeper cluster extension by merely providing some more ram, open connection quota and 'tick' duration increase in the cluster settings (lowering a little the reactivity, but reducing the zookeper cluster workload).
Apache Kafka
The big picture
Kafka is used for fast,resilient short-term storage and queuing (seconds to days).
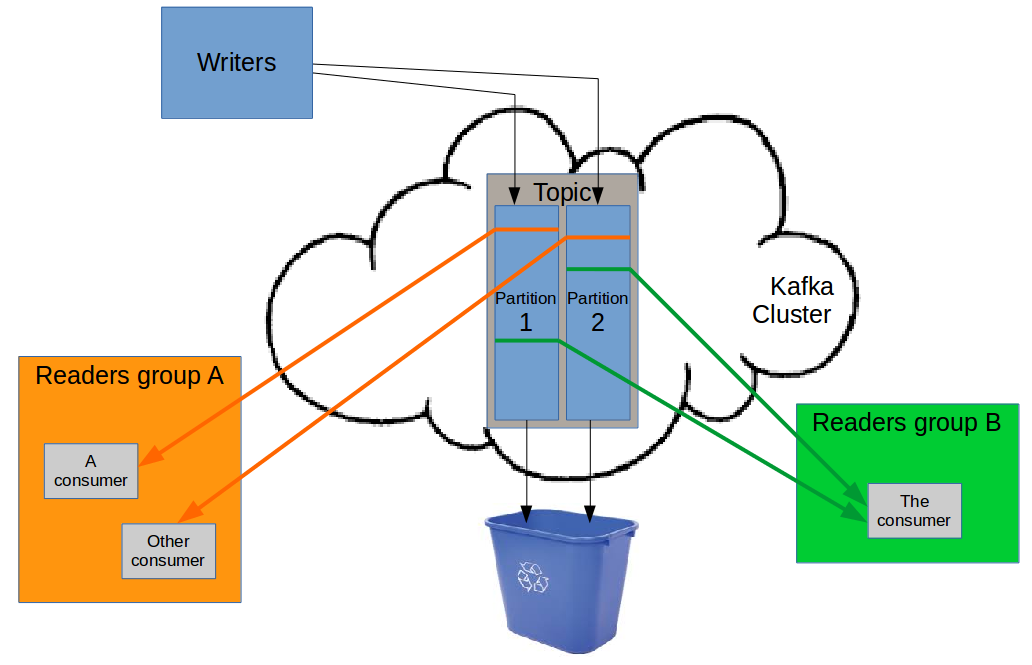
But kafka is not really a message queue manager. It is more like a whiteboard where one producer writes
sequences of records/events (called topics) and multiple groups of consumers can read independently the same topic
data if they want.
-
Kafka itself does not track what has been read or not (and therefore not what has been safely processed or not).
-
Therefore consumers application processes are responsible for tracking what they have read/safely processed and managing their restart reading point when some failure occurs and a consuming restarts.
-
Kafka will destroy the
oldtopic data based on the topic retention settings independently from whether the data has been read/consumed/processed.
At least once processing guarantee
Kafka consumer library provides a standard way for a consuming application to track what data has been
safely read and processed: an offset which is a reading position in the input data.
The consequences are:
-
When a consumer restart, it will go 'back' to reading from the last registered
processedoffset, allowing forat least onceprocessing guarantee (as long as this consuming application does notcommitan offset before the matching data is safely processed/stored/forwarded). -
Because of this
sequentialreading and progress tracking, if you need to have cooperating processes sharing the load of processing the data from a topic, you need to shard the topic intopartitionswhich contain part of the topic data, with a singleoffsetmanaged for each partition, by one of the cooperating consumers.Such cooperating consumers are a
consumers group, identified by agroup id/name.
Kafka consumer library embeds the automatic "responsibility sharing" code that allows multiple consumers in a group to distribute among themselves the responsibility of handling each of a topic existing partitions, one partition being handled by one and only one consumer of the group at a time (of course a consumer can handle reading multiple partitions from the same topic simultaneously, if there are more partitions in this topic than consumers in the group).
-
All this allows the same topic data to be consumed independently, at different speed/latency by different consumers groups, in charge of different kind of data processing (e.g.:
- one group in charge of indexing the data into a database backend,
- one group in charge of forwarding the data to some dual disaster-recovery site
- one group in charge of archiving the data to some long-term storage ).
This provides a good consuming services availability independency: if any of the group is blocked (because the targeted back end is unavailable), the other groups can still process nominally the data for other usages.
If the blocked group is again able to process the data (back-end or network back online) this group will be able to read and process the
backlogdata as fast as its resources allow, as long as the data was not erased by Kafka due to retention setting.
Scalability
The constraints / needed resources
Kafka is java(scala) based, working in memory for fast data ingestion, so the higher the throughput, the higher the RAM is needed by the broker (to avoid the java GC to take too much cpu/latency). 1 MB is often appropriate for most punch use cases (a few KEPS per broker), although some Kafka advises can require much higher RAM in severe use cases. Anyway, internal JVM actual RAM usage using 'jstat' is advised in integration phase to ensure RAM allocation is appropriate during load testing.
CPU usage is not intensive, although increased by SSL use, and depending on compression mode. Again, load testing is needed for appropriate per-use-case sizing.
Kafka is not disk-intensive as it uses RAM first, writing data to disk mostly in a segmented/append-only approach.
Cluster scaling
Kafka itself is horizontally scalable by adding Kafka cluster nodes (called brokers).
Brokers can be added without stopping the Kafka clusters
Important
Note that kafka will evenly distribute the responsibility of partitions storage and handling between the brokers
that are currently online at the time when the topic is created.
This means that if you want to add brokers after that, you may have to re-distribute the load in the cluster either by manually reassigning partitions to the new brokers (using kafka tools)
consumers scaling and partitions counts
If you need to scale the processing capacity by adding more consumers in a given consumers group, you will
be limited by the number of partitions existing in the topic (excess consumers will be in fact processing nothing, as they are responsible
for no partition).
So the best way is : - to have more partitions in each topic than what you expect to be needing - to have a number of partitions which is a multiple of your number of consumers in the group, for even distribution of load.
Important
It is possible to create additional partitions without stopping kafka, nor the consumers and producers. BUT in fact, producers may be unable to write to the new partitions until they restart their kafka producer layer (so sometimes this needs a restart of the producer process/punchline to actually make use of the additional partition).
consistent ordering in multi-partitions use cases.
When scaling a topic to multiple partitions, the producer will by default randomly(evenly) distribute its new message to the various partitions.
Of course, this conducts to a loss of order if the messages or then regrouped and processed together in a later part of the chain.
If a later component in the chain needs to be sure that events related to a same subject/business object are received in ordered sequence, then a specific configuration of the Kafka producers must be used to guarantee that all messages related to this subject are sent in a same partition. This is done by providing a 'sharding key' to Kafka. Of course, other causes of order loss can exist in the chain (like multiple threads sharing the processing load in an application, behind a single Kafka consumer).
High Availability and Data Protection
Both Data protection against failure of a single Kafka node, and High availability of the Kafka cluster are achieved through - having at least two brokers in the cluster - requiring Kafka to store additional copies of the topic data (replication-factor >= 2) - having a highly available underlying Zookeeper cluster (that also brings guarantees against split-brain risks in kafka)
Consumer services availability relies on - at least 1 of the copies of each topic partition to be available. So if the partition is replicated, and only one of the partition replica is down, the consumer will continue its reading/processing. - availability or cardinality of consumer group (i.e. either multiple consumers in group, or some external mean to respawn consumer service somewhere else)
Producer services availability is influenced by a configuration that allows to set the cursor between availability against that protection: the number of required brokers acknowledgment. If you have a topic with replication-factor 2, but one of the brokers responsible for a partition of this topic is down, then - either you have required 1 acknowlegement in producer configuration, and the producer process will not be blocked (but your data will not be safely replicated until the missing broker is online again) - or you have required 2 acknowlegements (which protects your data against loss due to sudden failure of one of these brokers) but then your producer is blocked until the missing broker is online again.
If you needed both producer availability against single broker failure AND additional guarantee of no data loss in case of ADDITIONAL failure of a second broker, then of course you would need a replication-factor of at least 3 (with associated storage need increase) and to set the required acknowledgements to 2.
Most usual setup in log management chains is: at first ingress of external data, require only '1' acknowlegement to achieve high availability of the data ingress port; at further steps of the processing chain, require '2' to reduce data loss/unprocessing risks.
Data lifecycle
Data retention rules May be tricky to design: - Kafka does not take into account what storage space remain. - The "max size" retention rule for a topic applies to each partition. Raise the number of partitions and you increase the maximum size on disk of the topic data. - Kafka will delete the data as soon as the first deletion rule triggers (size retention or time-based retention). This means that in case of flooding, data may be deleted faster than the time-based retention setting.
Automatic data deletion rules are set independently for each topic and can be changed at runtime without stopping any processing.
And remember that Kafka will delete data independently from the consuming status.
All this emphasizes the importance of - sizing the kafka underlying storage and retention settings with input floods scenarii in mind.. - having good monitoring/automatic alerting rules to trigger MCO teamp in case of a failure in the consumer stages - having a storage space computed for the time it takes the MCO team to react and solve an incident (so 5 to 7 days might be a good idea, for long week-ends and heavy incidents!)
Kafka has an optional compaction feature, that can be activated on topics that contain "objects full updates" kind of record. This feature expects the messages to have been writtent by the producer in association with an object id. Kafka can then be configured to remove old data, keepîng only the most recent message associated to each given object id. This allows to use Kafka as a "state store" for objects, while reducing the need to keep a lot of old data. This feature is used in Punch for Shiva management kafka topics (configured automatically by the punch deployer tool)
Elasticsearch
The big picture
Elasticsearch is a document-oriented database, made for finding and aggregating (json) structured documents based on multiple fields/values/keywords taken from this document.
The underlying fields indexing engine is Lucene. Elasticsearch adds scalability and operation features (sharding, replication, indices lifecycle management, multi-nodes aggregation..): an Elasticsearch indice is the a scalable, optionnally replicated, distributed entity composed of:
- collection of indexes about same set of documents
- “column” of all documents “_source” (i.e. the full original json document)
- “columns” of some fields values (for fast aggregations on documents, for fast extraction of field…)
As for other databases, the configuration (fields 'mapping') decides which fields from the documents are indexed (to allow documents selection using this field) and the technical indexing settings (type of the field, grain of geographic indexing, text case sensibility...). These settings allow to tune for CPU / Storage consumption when indexing documents, and for search/aggregation capacity/efficiency at the end.
Elasticsearch is capable of full-text, keyword-based searching. In the log managemnt context, this is not the most needed feature. The most leveraged ones are simple keyword-based indexing, URL/domain customisable indexing, IP ranges indexing, geographic indexing.
A document is indexed globally, in a mostly 'append only' segmented storage, so the indexing phase is not really io-intensive. But 'updating' a document basically means re-indexing the whole document, and doing (costly) later compaction to revoke the previously indexed version
Elasticsearch is an in fine consistent database ; meaning that for performance/distribution sake, when you index a document, this document will be taken into account by requests, but only after some time. This 'refresh interval' is an important setting to achieve good Elastic engine performance ; usual production values in log management are about 1 or 2 minutes.
Elastic type of queries
Elasticsearch is most powerful for:
- counts: Runs a filter to find amounts of related documents, but not return them
- search: Runs a filter, and return SOME of the documents (or ALL of them, through a
scrolling, multiple-requests mechanism) - aggregates:
- run a search fiter
- sort documents on the fly in SOME « multi-dimensioned buckets » (FINITE buckets count, so SOME docs only)
- compute metrics in the buckets
- Return the « more interesting » buckets, based on a bucket metric
- (optionnally) return some documents within each bucket
- Unique counts of distinct values in fields of matching documents (But no magic here => in a distributed world, this is not an exact counting, but a pretty smart estimation)
High-Availability and Data protection
Have a look at the sharding logic.
Key points
- Indices are
shardedat creation time, to allow for balancing the indexing/querying effort over multiple cluster nodes. - Indices shards can be
replicated(replica count=1 meaning 2 storage) for both service availability and data protection* against failure of a cluster node. - like Kafka, Elasticsearch will automatically bring the replica to perfect copy status, once a node is available for this replica
-
Contrary to Kafka, Elasticsearch actively, automatically and dynamically:
- rebuilds missing replica to some other remaining online node, even before the missing cluster node is repaired
- re-balances shards and replica between nodes to have even usage of disks
- dynamically assign shards from (often daily) new indices on cluster nodes based on their current load
Elasticsearch master nodes act as an internal integrity/cluster management decision maker.
- for a highly available Elasticsearch cluster, resisting to a single-node failure, you need only 2 nodes allowed to have master role (they can also have 'data' node role for small clusters)
- But in fact to achieve production-grade resistance against split-brain (that can lead to stuck service or data loss) , at least 3 master nodes minimum are required
Scalability
Elasticsearch is horizontally scalable
Additional data nodes can be added without cluster restart. Data will even out on the new nodes given enough time (because of safety throughput-throttling thresholds when moving shards data in the cluster)
The "master" nodes should be dedicated for big clusters (more than 10 nodes, more than a few hundreds shards), as these master participate in important indice-level synchronization actions and cluster management (shards balancing...) ; so if they are resources-starved by biq queries because of a co-located "data" or "client" role, the cluster can become difficult to operate.
Client/coordinator nodes are an optional type of nodes, that act as a querying proxy, to avoid loading arbitrary storage nodes when a big query is handled. This is because the API node (client or data) that handles a query will: - fan out the query to all shards that may match the query - retrieve the results, re-aggregate them if needed, and re-sort them if required. These are the steps that could require RAM, and can be heavy sometimes if colocated with the actual workload of searching in the locally handled shards.
Resources needs / sizing
There are few sizing rules for Elastic, as it is heavily related to
- use case, data model and queries types
- 'normal' latency expected upon querying (100 ms or 3 minutes ?)
- hardware specs (nb of cpus, disk IO throughput)
So actually the official sizing process is
- inject a good bunch of representative documents (100 million) in a single shard on a test hardware (1 server or VM)
- notice the used storage (see cat/indices API) to determine the storage you'll need at the end for all your data
- do indexing and see the consumed CPU
- do queries (clearing up OS cache beforehand) and see the response time.
- adjust hardware up (SSD) or number of documents in shard (down) until performance is the one you want (i.e. both
- scale up your cluster with this ratio of stored data/node, until you reach your total storage capacity for the online query-able data
- adjust cpu/sharding based on previous measure to reach the needed indexing throughput (to avoid unnecessary cpu allocation)
- remember that indexing is CPU-related while querying is IO-related. Be sure to check both and to watch out for iowaits !
Common sizing rule of thumb for log management is
- For log management with 10s/60s-class response time, you'll need only magnetic Hard drives and an overall RAM/Storage ration of about 1/50 to 1/100 (meaning 1 GB of RAM for each 50GB of stored data).
- For IO intensive, faster class response time, you'll probably need SSD, and much higher RAM/Storage ratio (up to 1/10) to make better use of OS file caches. ==> Have a look at suggested VM characteristics on Elastic-hosted "As a service" Elasticsearch...
- Never use Elastic JVMs bigger than 31.9 Gb RAM (this is because when you reach 32Gb, the JVM shifts its memory mode to long pointers, loosing much RAM !!!)
- Have the server/VM actual RAM double the JVM size (i.e. a 64 GB OS for hosting a 31.9 GB Elastic node)
Beware big queries:
AS any database, you can always exceed available memory by using a nasty-enough query. The Elasticsearch-node/cluster-killer is the OutOfMemory caused by queries combining (by decreasing risk level): - #1- multi-dimensioned bucketted aggregation with too-many dimensions (as the requested max bucket size for each dimension are multiplied by each other) - #2- too-many shards/indices targetted by the query (they may all work at the same time to answer the query, multiplying the ram consumption) - #3 - (too-many) multi-fields selection that will imply loading up a lot of indices data in RAM at the same time
Data lifecycle management
Data replication, though useful for service availability, is costly in disks, especially if you want to be able to query quite long-term data (several months for example).
Data replication is absolutely may be a lifesaver for live data (meaning data from the current or very recent days, that can still be written to, and therefore is at risk of inconsistency in case of sudden node crash).
For more older data (over a week ?) you may want to reduce replication(and availability), relying on hardware level safety (like local RAID on the servers disk) instead of full application-level redundancy.
You may want also to have faster SSD disk or higher RAM/disk ratio for recent data (if it is more often queried), and use classical magnetic disks and less RAM/disk ratio for other nodes, in charge of older less-often queried data.

For that you can leverage Elastic capability to hot-move safely shards data between node: - you specialize your cluster nodes, and "tag" them (fast/slow/indexing,....) - you configure the Punch housekeeper (relying on Elastic curator tool) to automatically change the tags or replication settings for indices families based on their age - you can also configure it to destroy obsolete indices, but only "close" indices that are probably not needed anymore, but that you do not want to delete yet (this frees memory) in case...
Shiva
The big picture
Shiva is a small highly-available java-based distributed cron/systemd cluster, both handling ever-running tasks (usually storm-like punchlines or plans), periodic execution tasks (housekeeping, data gathering custom tasks...) and one-off tasks (see books).
Shiva relies on Kafka for its cluster management and command/signalling.
You can refer to Shiva protocol for more details
- Commands are issued to shiva by writing to a specific Kafka topic.
- Cluster nodes are signalling their status through an other topic.
- In the cluster, other topics are used so that one of the node (elected
leader) can assign tasks to appropriate online nodes.
You can run arbitrary tasks/scripts under shiva control (not only the pre-packaged Punchplatform application)
High-availability
Shiva high availability relies on: - deploying at least 2 shiva nodes configured to allow them to be 'leaders' - deploying at least 2 shiva nodes allowed to run each type of your tasks (you can use 'tags' to restrict tasks execution to a specific subset of shiva nodes in the cluster.) - having a highly available kafka cluster (i.e. at least 2 brokers nodes, and at least 3 zookeeper nodes)
Scalability
Shiva itself requires few resources (low CPU, less than 1GB RAM). Scalability is related to the processing you are going to run in your various cluster areas. Shiva placement logic is purely "even" tasks assignements between nodes allowing to run a task. Tasks will not be dynamically reassigned to rebalance load, once they are started on a node. If more careful resources-aware placement or of tasks is needed, then have a thought for deploying Storm.
Apache Storm
The big picture
Storm is a scalable computing farm AND a distributed acknowledgment & inter-process communication framework allowing to easily scale tasks pipelines over multiple processes.
A storm task (called topology) is defined by a directed, acyclic graph (DAG) of input nodes (spouts) and of processing nodes(bolts) in which
the data will flow.
Storm provides the acknowledgment mechanics to guarantee the at_least_once execution of each data input at spout level, in each
successive bolts of the graph.
Storm allows to define the number of tasks/threads (executors) that will share the processing load of each node in the graph, allowing
to scale the task throughout.
It also provides the communication framework to seamlessly allow to scale a task graph over multiple JVMs, allowing
to leverage the CPU and RAM of multiple servers for a single scalable task.
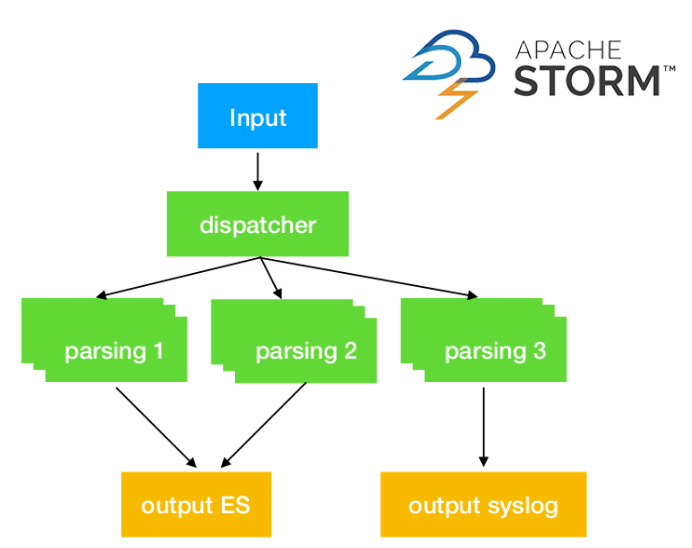
Important
Although the above graph is a nice illustration of the graph concept, it is a bad idea to have multiple different output backends in a single Storm topology ! Here, if one of the output is unavailable (ES or network), the whole graph will be 'stuck/repeating' because of the lack of acknowlegement, and no output will occur even on the backend that is available. See Kafka-based 'Y' pattern for the good answer to that !
In Punch, - the graph is defined by configuration instead of needing a coding environment - the nodes can be provided by punch nodes library or by customer-provided specific nodes.
High-availability
Storm relies on Zookeeper for cluster management and nodes detection.
It can deliver high-availability of the cluster (i.e. ability to restart/reassign tasks in case of single node failure) through: - at least two slave "supervisor" nodes able to run tasks - at least two "nimbus" master nodes able to reassign tasks if a supervisor node fails. - underlying zookeeper cluster high availability (>= 3 nodes)
The tasks assigned to the cluster are automatically restarted (in a few seconds) if they fail on their own, or due to a failure of the underlying supervisor node.
Scalability
Storm is horizontally scalable CPU-wise and RAM-wise by adding supervisor nodes. This can be done without stopping the cluster or the tasks running on the cluster.
Storm is able of resource-aware assignment, ie. to assigning tasks to supervisor nodes in a balanced way based on their declared resources need (a number of CPU and amount of RAM) as compared to the resources declared by the configuration of each supervisor node and their already assigned tasks.
Your Storm-punchlines may be scaled over multiple workers/jvms very simply by just changing numbers in your punchline file. This is handy
when you hit some local cpu limit, or when your single punchline is unbalancing your whole cluster. But if you scale to too many jvms, you will reduce stability,
as the failure/restart of any one of the JVM will cause acknowlegement failures/replays in the whole topology of the punchline, potentially
causing cascading restarts of other JVMs running the punchline, because of processing timeouts. So in unstable environments (platform expected to sustain nodes reboots like on clouds or co-hosted situation with other heavy apps), they should be avoided if possible.
It stays anyway possible to scale/load-balance by running multiple instances of the same punchline, consuming a shared multi-partitioned kafka queue. This is the
scalability pattern that works ALSO inside Shiva, with a proper templating that can be done using channelctl configure command.
Data protection
Although Storm does not store data (except the submitted tasks information in zookeeper and on master nodes), it contributes to the overall data-protection through the at_least_once guarantee of processing between two safe storage backends (kafka, Elastic, archive, networ peers). This relies to usage of production-safe nodes (that's one of the point of the Punch standard storm node, but be careful when you code your own !). And sometimes, punch nodes can have safe and unsafe settings (for test purpose, or to prioritize chain availability against at_least_once guarantee). Be sure to see Reference architecture section for production examples of punchlines, and Reference guide in documentation for available settings.
This applies also to Shiva-hosted punchline, as the 'light' execution engine emulates Storm behaviour but depends on the same nodes qualities.