Log Central : Platform Events dispatcher punchlines (3)
Key design highlights
Transport / interface / HA
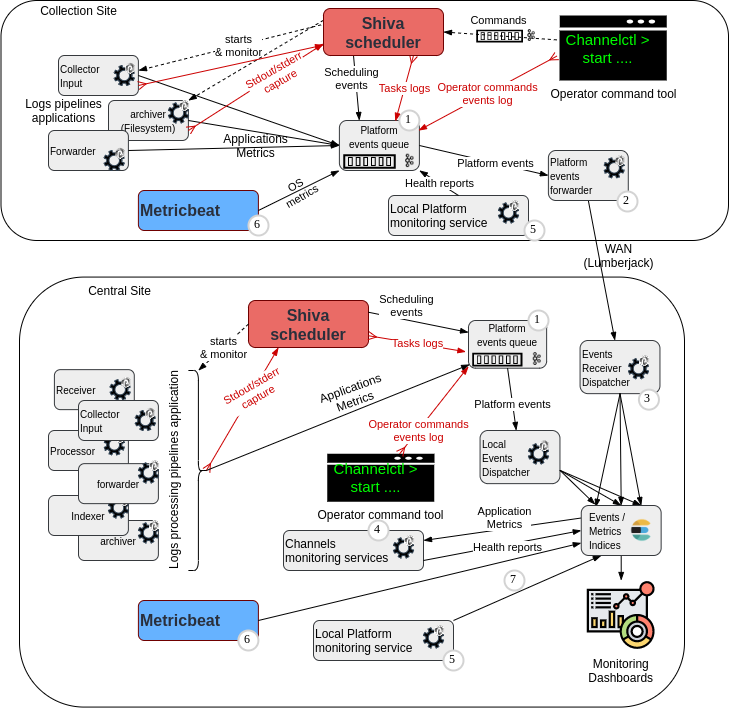
The logs are received from Log Collectors in lumberjack protocol, in a load-balanced way through an inbuilt balancing mechanism of the sender site. Here a Punch lumberjack output node acts as an emitter in a forwarder punchline of the Log Collector.
To achieve High Availability, at least two receiver punchlines are started on different nodes. To fix punchline location on a node, we use Shiva tags. Each Shiva node has a default tag matching the hostname. In legacy configurations, a 1-node Storm cluster could be used instead. A copy of the punchline is run inside each single-noded Storm cluster.
With multiple receivers, we also have scalability of input, because the lumberjack sender (lumberjack output node) is load-balancing over all available lmuberjack receivers. They will combine their throughput capacity as long as the target Kafka cluster is configured as needed.
Multiple target indices
The different kind of platform events are written to separate target indices. The target indice depends on the source of the data, and the desired retention duration. For example, operator start/stop commands must be kept for more than 1 year, to ensure that automated channels monitoring services are taking into account last known operator action on ALL applications of the platform, even those that are rarely stopped.
The standard indices naming for dispatching events is indicated in Tenants configuration indices table
The switching rule is implemented in this punchlet :
    /**
     * This punchlet takes platform events coming from an LTR or a Back Office "platform-monitoring" kafka topics. Events are
     * written in a Kafka topic using the "JSON" format so only
     * one field is generated. Here, we re-do the "Y" to send
     * events to the right Elasticsearch index
     * We need separate indices, because retention rules are not the same for different platform events types,
     * and to ease querying.
     * (e.g. 1 year for punchctl operator commands audit events,
     * 3 days for system metrics, a few days more for platform health...)

     * This is a reference configuration item for DAVE 6.0 release - checked 21/07/2020 by CVF

     */
    {
        root = [docs];
        String docType = "undetermined";
        String indexPrefix = "platform-errors-";
        String indexType = "daily";
        String platform  = "undetermined";
        String forwardingHost = "undetermined";
        String tenant = "undetermined";

        if (world:[meta][platform_id]) {
            platform = world:[meta][platform_id] ;
        }

        if ( world:[meta][tenant] ) {
            tenant = world:[meta][tenant];
        }
        String release_index_prefix = "";
        if (world:[meta][index_prefix]) {
            release_index_prefix = world:[meta][index_prefix];
        }


        // If we have a json document that already holds platform id or tenant info, then retrieve it...
        if ( [doc][platform][id]) {
            platform = [doc][platform][id];
        }

        // If we have received the event from a remote sender, and the punchline publishes the info,
        // then we keep track of the host that sent the event on the network
        // This is useful if the actual platform id is not available or ambiguous.

        if ( [_ppf_remote_host] ) {
            forwardingHost = [_ppf_remote_host];
            [doc][platform][forwarding_host] = [_ppf_remote_host];
        }


        if ( [doc][platform][tenant] ) {
            tenant = [doc][platform][tenant];
        } else {
            [doc][platform][tenant] = tenant;
        }


        if ( [doc][type] ) {
            docType = [doc][type];
        } else if ( [doc][@metadata][beat] ) {
            docType =  [doc][@metadata][beat];
        }
        else if ( [doc][service][type] ) {
            docType =  [doc][service][type];
        } else if ( [doc][target][type] ) {
            docType =  [doc][target][type];
        }

        // The timestamp of the eventis normally available in the incoming json standard field following beats convention:
        String dateString = null;
        if ([doc][@timestamp]) {
            dateString = [doc][@timestamp];
        }

        switch (docType) {
            case "platform":
            case "platform-monitoring":
                indexPrefix = "platform-monitoring-";
                break;
            case "channels-monitoring":
                indexPrefix = tenant + "-channels-monitoring-";
                break;
            case "platform-health":
                indexPrefix = "platform-health-";
                break;
            case "storm":
                indexPrefix = tenant + "-metrics-";
                break;
            case "gateway-execution":
            case "gateway":
                indexPrefix = tenant + "-gateway-logs-";
                break;
            case "spark":
                indexPrefix = tenant + "-spark-metrics-";
                break;
            case "spark-application":
                indexPrefix = tenant + "-spark-metrics-";
                break;
            case "punch":
                // We separate the operator commands from the verbose logs, to be able to keep these commands for more than a year, because they are needed for channels monitoring activation
                if (([doc][init][process][name] == "channelctl") || ([doc][init][process][name] == "punchctl")) {
                    indexPrefix = "platform-operator-logs-";
                    indexType = "monthly";
                } else {
                    indexPrefix = "platform-logs-";
                }
                break;
            case "metricbeat":
                indexPrefix = "platform-metricbeat-" + [doc][@metadata][version] + "-";
                break;
            default:
                String errorMessage =  "Unable to dispatch unknown monitoring document type ('" + docType + "') forwarded from host '" + forwardingHost + "' (platform '" + platform + "'' .";
                throw new PunchRuntimeException(errorMessage);
            }

        String elasticsearch_date = "nodate-errors";
        if (dateString != null) {
            if (indexType == "daily") {
                    // here, the input date is : 2019-10-10T17:07:39.951Z
                 elasticsearch_date = date("yyyy.MM.dd", "yyyy-MM-dd'T'HH:mm:ss.SSS'Z'").on(dateString).get();
            } else {
                // Monthly case
                    // here, the input date is : 2019-10-10T17:07:39.951Z
                 elasticsearch_date = date("yyyy.MM", "yyyy-MM-dd'T'HH:mm:ss.SSS'Z'").on(dateString).get();
            }
        }
        [index] = indexPrefix +  release_index_prefix + elasticsearch_date;

    }
Reference configuration example
Collector monitoring channel_structure example
As explained above, the receiving application (here input) must be run in multiple instances located on each of the servers. This is an example on how to use Shiva tags in channel_structure.yaml :
# This channel handles forwarded ltr site monitoring data.
# It normally runs the same punchline on multiple input nodes that receive lumebrjack forwarding for ltrs.
# The punchline writes the logs/events received from the ltr into various elasticsearch indices.

version: "6.0"
start_by_tenant: true
stop_by_tenant: true
applications:

  # collector events receiver front1
  - name: collector_events_receiver1
    runtime: shiva
    cluster: shiva_front
    shiva_runner_tags:
    - centralfront1
    command: punchlinectl
    args:
      - start
      - --punchline
      - receiver.yaml
      - --childopts
      - -Xms96m -Xmx96m # will override topology.component.resources.onheap.memory.mb

  # collector events receiver front2
  - name: collector_events_receiver2
    runtime: shiva
    cluster: shiva_front
    shiva_runner_tags:
    - centralfront2
    command: punchlinectl
    args:
      - start
      - --punchline
      - receiver.yaml
      - --childopts
      - -Xms96m -Xmx96m

  # collector events indexer
  - name: collector_events_indexer
    runtime: shiva
    cluster: shiva_front
    shiva_runner_tags:
    - shiva_front
    command: punchlinectl
    args:
      - start
      - --punchline
      - indexer.yaml
      - --childopts
      - -Xms256m -Xmx512m

resources:
  - type: kafka_topic
    cluster: kafka_front
    name: platform-collector-events
    partitions: 1
    replication_factor: 1
Remote collecter monitoring events receiver/dispatcher punchline example
The associated dispatcher punchline for ltr/collection-site forwarded platform events usually looks like this:
# The purpose of this punchline is to receive various types of platform events from a source (LTR collector)
# platform, and to dispatch these different events into different indices
# so that they have different retention rules.

# This is important because all platform events (platform metrics, operator commands audit events, health monitoring status...)
# are coming through a single events flow (especially when coming from remote platforms).

version: "6.0"
tenant: platform
channel: collector_monitoring
runtime: shiva
type: punchline
name: collector_events_receiver

dag:

  # Lumberjack input
  - type: lumberjack_input
    settings:
      listen:
        host: 0.0.0.0 # can be resolved to specify an interface
        port: 1711
        compression: true
        ssl: true
        ssl_private_key: "@{PUNCHPLATFORM_SECRETS_DIR}/server.pem"
        ssl_certificate: "@{PUNCHPLATFORM_SECRETS_DIR}/server.crt"
        ssl_trusted_certificate: "@{PUNCHPLATFORM_SECRETS_DIR}/fullchain-collector.crt"
    publish:
      - stream: docs
        # The remote host metadata field can be used to track from which remote host(platform)
        # an event has been received. This is just additional tracability information
        # because the received documents (json) normally include a platform id field.
        fields:
          - doc
          - _ppf_remote_host

  # kafka output
  - type: kafka_output
    component: kafka_front_output
    settings:
      topic: platform-collector-events
      encoding: lumberjack
      producer.acks: "1"
    subscribe:
      - stream: docs
        component: lumberjack_input

metrics:
  reporters:
    - type: kafka
      reporting_interval: 60

settings:
  topology.max.spout.pending: 6000
  topology.component.resources.onheap.memory.mb: 200
Central site monitoring events dispatcher punchline example
# The purpose of this punchline is to receive various types of platform events from a source (LTR collector)
# platform, and to dispatch these different events into different indices
# so that they have different retention rules.

# This is important because all platform events (platform metrics, operator commands audit events, health monitoring status...)
# are coming through a single events flow (especially when coming from remote platforms).

version: "6.0"
tenant: platform
channel: collector_monitoring
runtime: shiva
type: punchline
name: collector_events_indexer

dag:

  # Kafka input
  - type: kafka_input
    component: kafka_front_input
    settings:
      topic: platform-collector-events
      encoding: lumberjack
      start_offset_strategy: last_committed
      auto.offset.reset: earliest
      self_monitoring.activation: true
      self_monitoring.period: 60
    publish:
      - stream: docs
        fields:
          - doc
          - _ppf_remote_host

  # Punchlet node
  - type: punchlet_node
    settings:
      punchlet:
        - standard/Platform/monitoring_dispatcher.punch
    subscribe:
      - component: kafka_front_input
        stream: docs
    publish:
      - stream: docs
        fields:
          - doc
          - index
      - stream: _ppf_errors
        fields:
          - _ppf_error_message
          - _ppf_error_document
          - _ppf_timestamp
          - _ppf_tenant
          - _ppf_channel

  # ES Output
  - type: elasticsearch_output
    settings:
      cluster_id: es_monitoring
      per_stream_settings:
        - stream: docs
          index:
            type: tuple_field # ES index has been determined by the dispatcher punchlet
            tuple_field: index
          document_json_field: doc
          additional_document_value_fields:
            - document_field: es_ts
              type: date
              format: iso
              # Now we deal with the error flows, which are escaped documents of the tuple
              # that caused the punchlet exception, and additional metadata fields
              # about the error and context
        - stream: _ppf_errors
          index:
            type: daily
            prefix: platform-monitoring-errors-
          document_json_field: _ppf_error_document
          additional_document_value_fields:
            - document_field: "@timestamp"
              type: date
              format: iso
            - document_field: tenant
              type: tuple_field
              tuple_field: _ppf_tenant
            - document_field: channel
              type: tuple_field
              tuple_field: _ppf_channel
            - document_field: error_message
              type: tuple_field
              tuple_field: _ppf_error_message
            - document_field: error_ts
              type: tuple_field
              tuple_field: _ppf_timestamp
              # In case Elasticearch rejects some insertion because of mapping error,
              # to be able to keep all events
              # AND troubleshoot the situation, the faulty documents will be inserted as
              # escaped error documents here :
      reindex_failed_documents: true
      error_index:
        type: daily
        prefix: platform-monitoring-errors-
    subscribe:
      - component: punchlet_node
        stream: docs
      - component: punchlet_node
        stream: _ppf_errors

metrics:
  reporters:
    - type: kafka
      reporting_interval: 60

settings:
  topology.max.spout.pending: 6000
  topology.component.resources.onheap.memory.mb: 200