Monitoring
The Punch comes with many tools to monitor : - system - COTS (Elasticsearch, Kafka, Storm etc...) - channels & punchlines
Most of the monitoring requires the monitoring channel on the platform tenant.
Here is how to activate it :
channelctl -t platform start --channel monitoring
System monitoring
Go to Kibana > Dashboards > [System Monitoring] Overview.
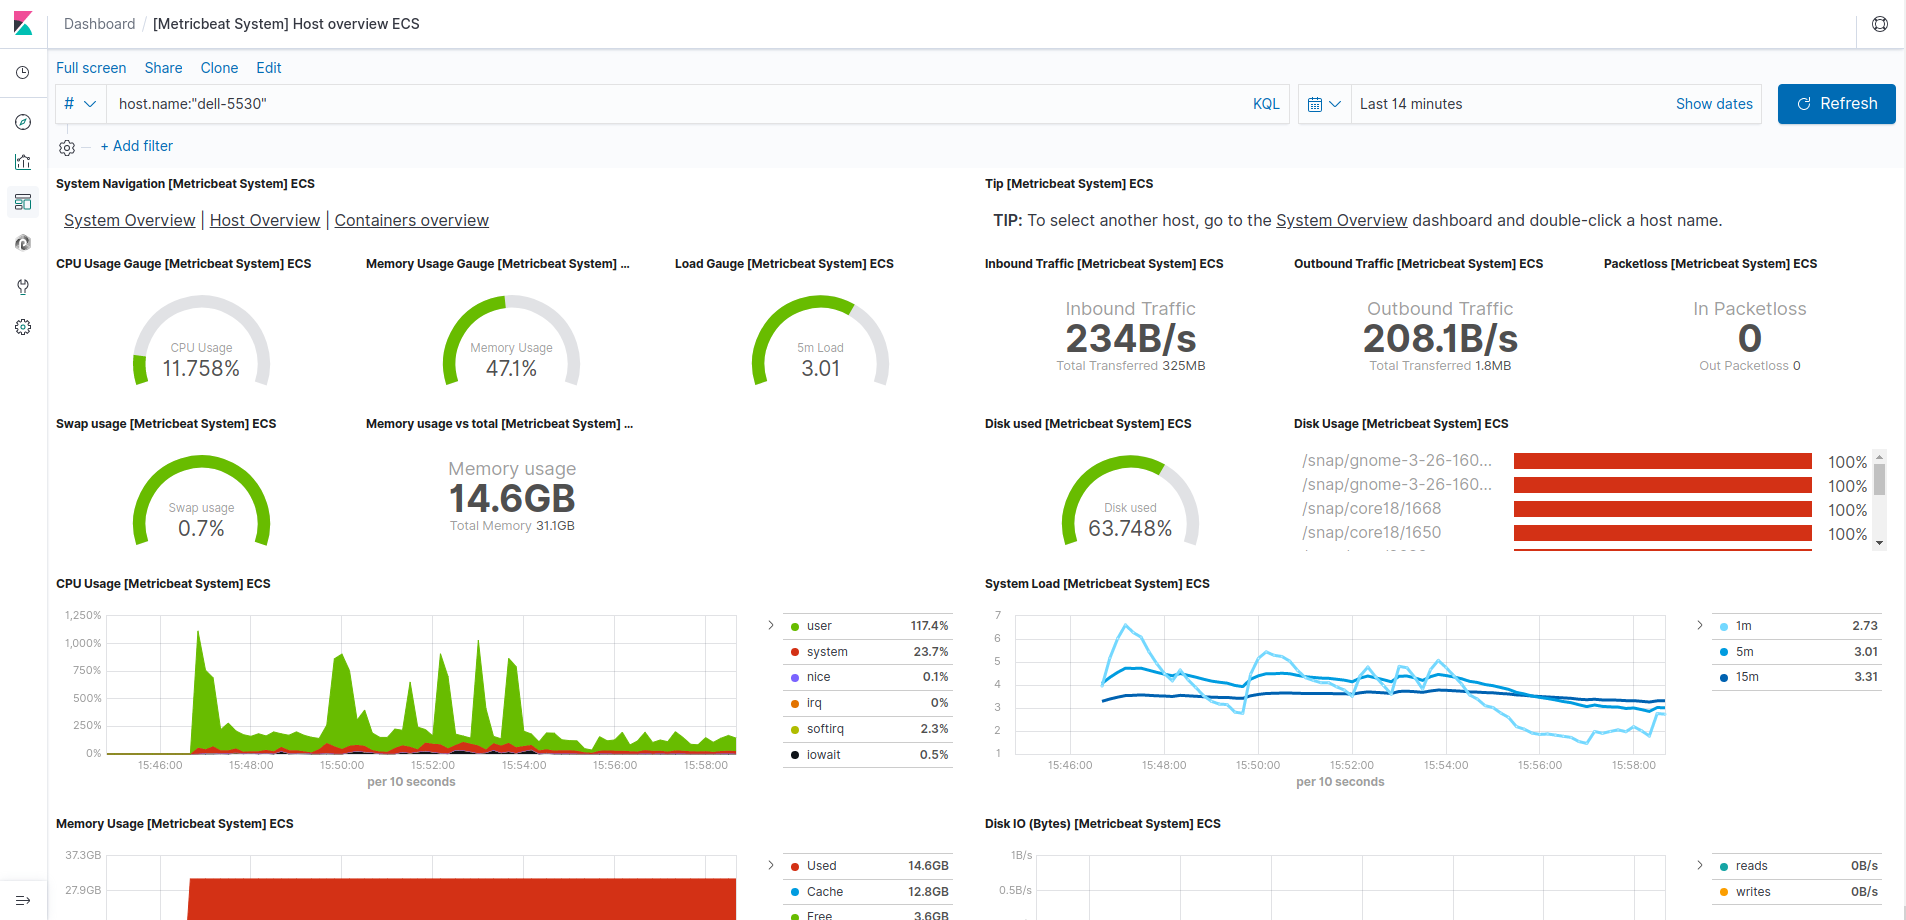
This dashboard is based on monitoring agents : Metricbeat It is shipped with the Standalone and is already running.
The Metricbeat collects various system and monitoring metrics and forwards them to Elasticsearch.
Platform monitoring
The Punchplatform has tools to monitor the platform and its COTS.
In foreground, there is the platformctl command-line tool to have a snapshot view of your COTS.
In background, there is the platform-monitoring application which is launched in a channel to monitor your COTS continuously.
platformctl
On your Standalone, get a view of all your components :
platformctl health
To get detailed health of a component :
platformctl health --service kafka
platform-monitoring
In the channel monitoring of platform tenant, there is a platform_health application.
This application monitors COTS continuously and send data to Elasticsearch (index platform-health-YYYY.MM.DD).
Checkout Kibana > Dashboards > [PTF] Platform
Channels & Punchlines monitoring
Channels are monitored at the tenant level.
It is already started on the platform tenant thanks to the command at the beginning of this chapter.
Let's start it for mytenant as well :
channelctl -t mytenant start --channel monitoring
This starts the channels_monitoring application.
This application does 2 things :
- It monitors the calls to
channelctl. - It forwards metrics from Shiva applications to
mytenant-metrics-YYYY.MM.DDindex in ES.
Start some channels in Shiva to check how they are monitored :
channelctl -t mytenant start --channel stormshield_networksecurity
channelctl -t mytenant start --channel websense_web_security
Go to Kibana > Dashboards > [PTF] Channels
Go to Kibana > Dashboards > [PTF] Logs
Go to Kibana > Dashboards > [PTF] Metrics