Punch Generic Dashboards
The Punchplatform comes with off-the-shelf dashboards to easily monitor your platform.
Have a look at Monitoring guide for a peek at things you may want to monitor (through standard or custom Dashboards)
Here is a list of standard dashboards that you can import in your monitoring Kibana instance. They are available as resources in the standalone and deployer package.
Please refer to each dashboard documentation page for standard resource file identification and dashboard name for finding the dashboard inside Kibana.
Punch Platform health monitoring dashboards
- Platform synthetic health overview dashboard
- Platform components health alerts dashboard
- Platform channels application health overview dashboard
- Shiva tasks events monitoring dashboard
Punchplatform application metrics monitoring dashboards
- Applications Key metrics overview dashboard
- Applications EPS/Ack/Fail metrics drilldown dashboard
- Applications RTT/Processing time metrics drilldown dashboard
- Applications metrics generic browser dashboard
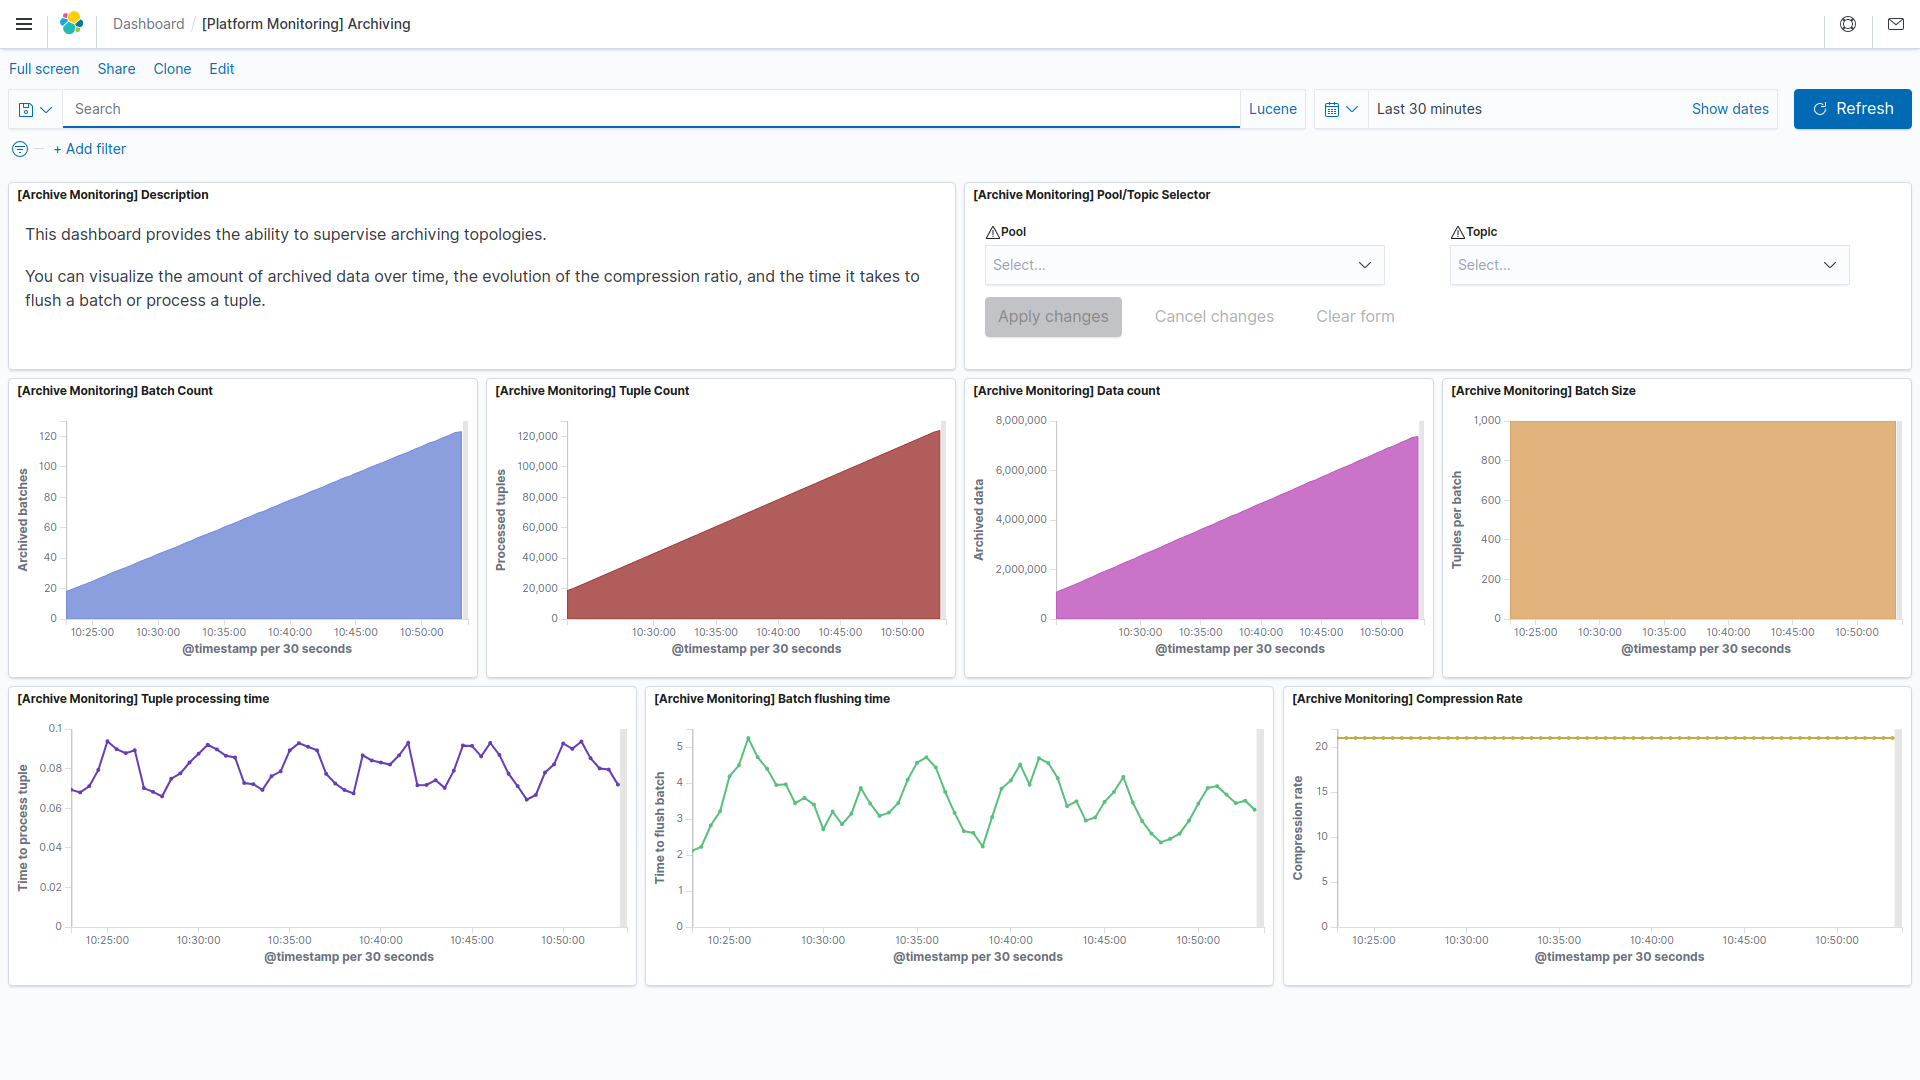
Archive monitoring
This dashboard permits you to monitor archiving process and stats about it
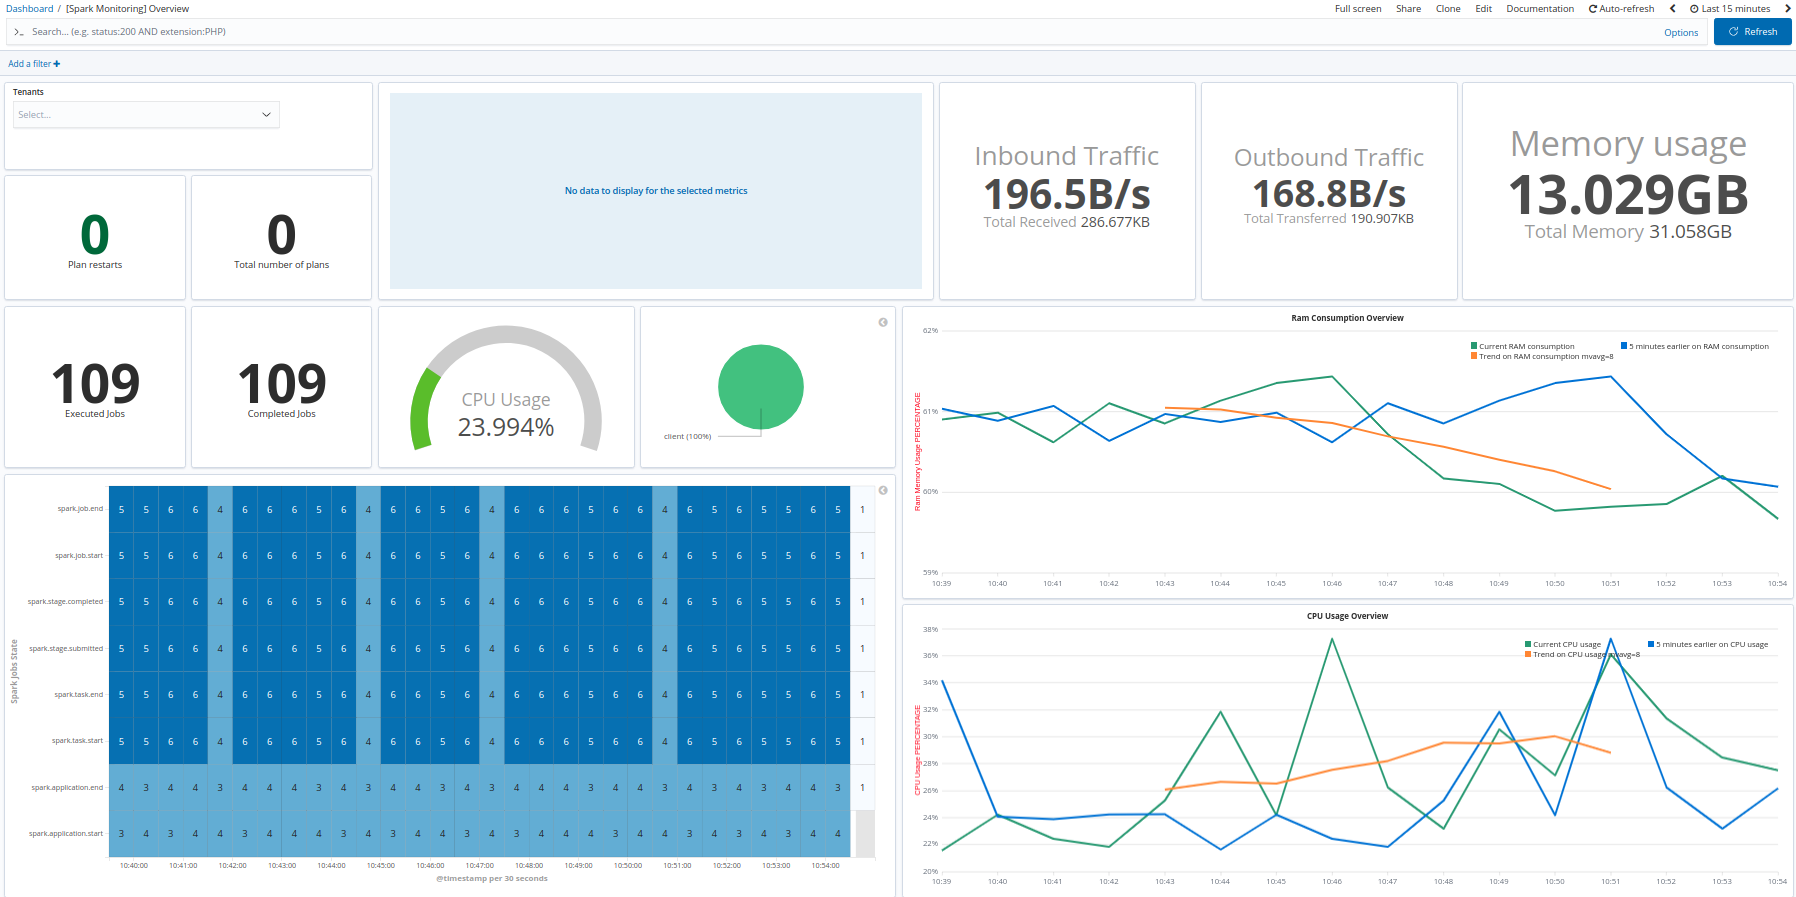
Spark monitoring
This dashboard permits you to monitor all Spark jobs status, plan workflow and system consumption on your platform
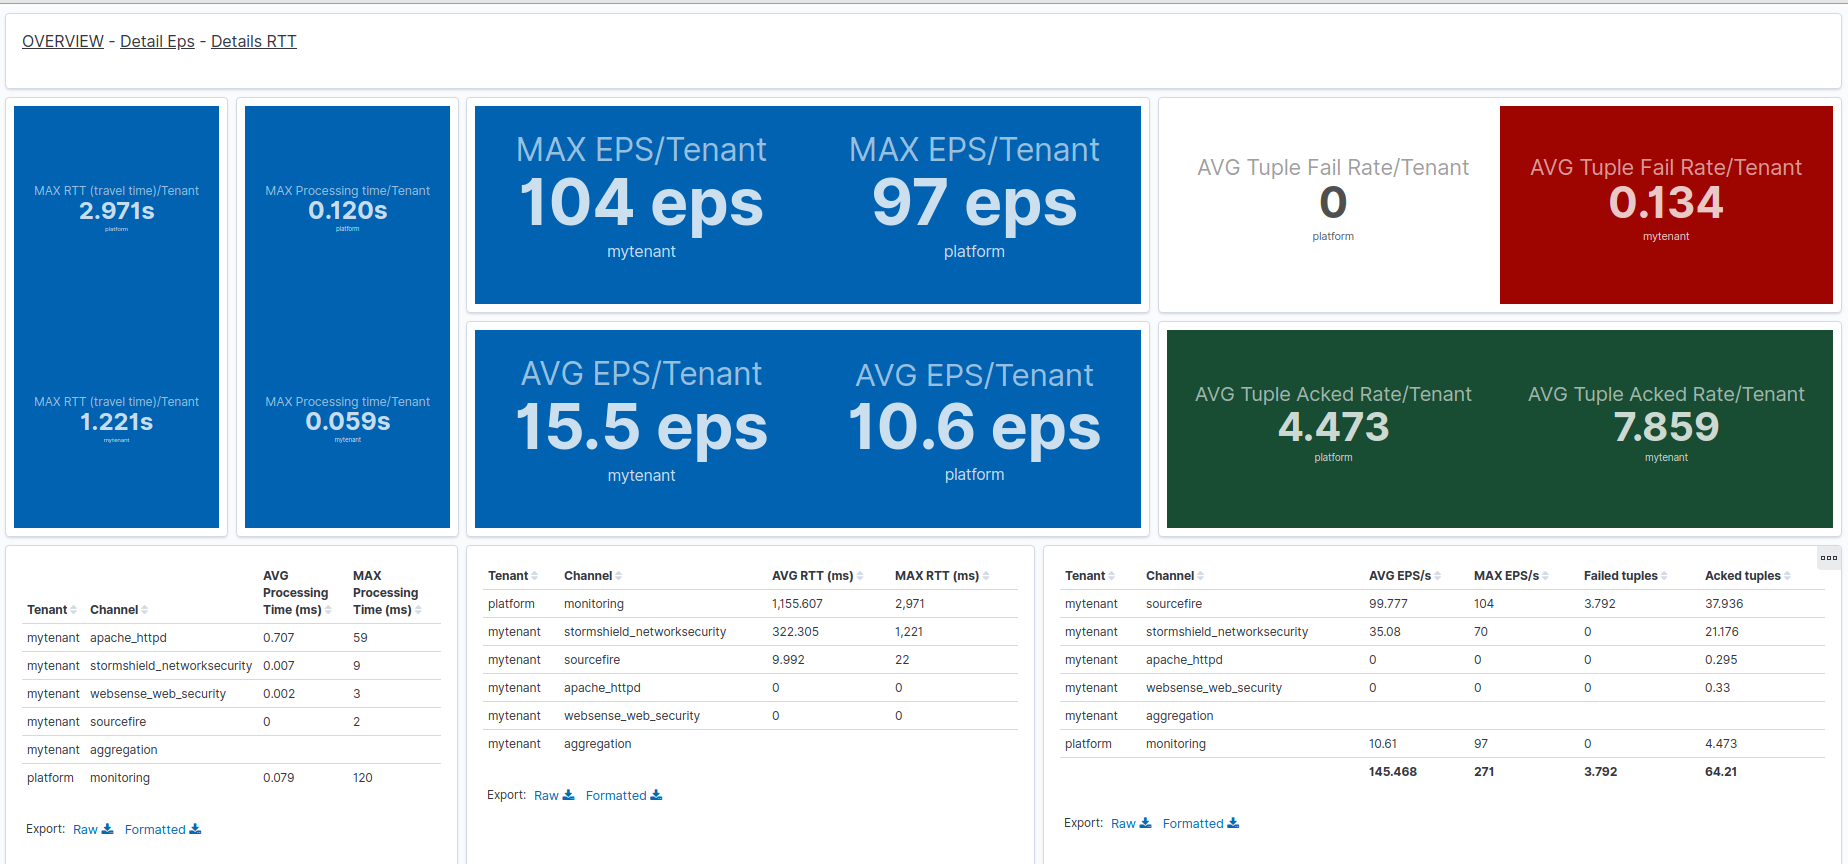
EPS monitoring
This dashboard permits you to monitor your Storm pipelines and check EPS (Event Per Second), Fail rate and processing time of the global pipeline . These metrics are aggregated by tenant, channel, storm topology and component (Storm Spout/Storm Bolt).