ADM Training - Track1: commands to know if/where things are running.
When everything is deployed, it is easy to check that everything is working thanks to Platformctl command (available since 6.3 release) or by looking at the platform monitoring dashboard calculated with Platform monitoring service
The right order
But what if you just deployed or switched on a platform, and you want to check by hand if everything works as expected ?
We'll work from the bottom fundation up to the applications levels. Of course, if some component framework is not used on your platform, just skip it...
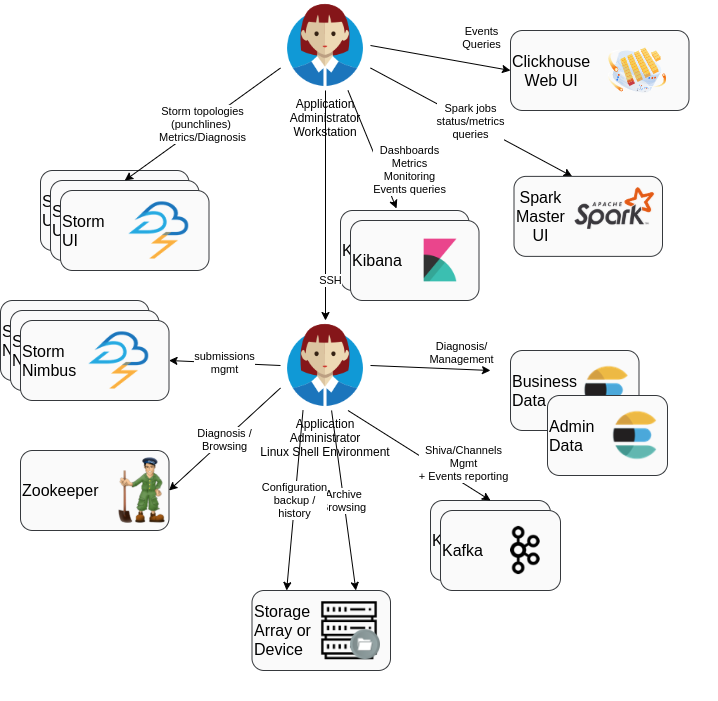
First, have a look at the components an Operator can exchange with...
Then, have a look at much more dependencies that exist between the framework components:
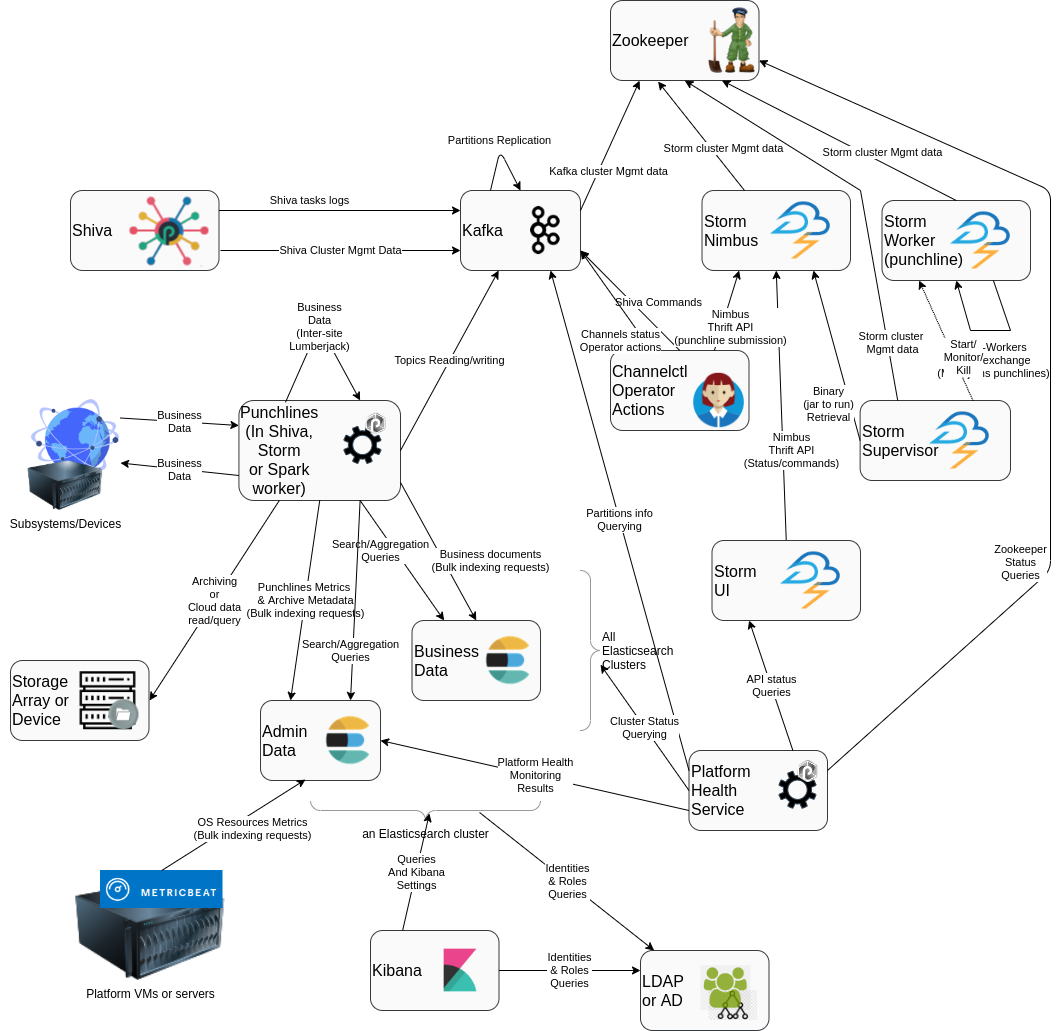
On the above diagram, the arrows are "dependencies" (more 'direction of the communication initiation' than actual data flow direction).
Do you see where to start (where are all arrows converging ?)
- Towards Zookeeper
- Towards Elasticsearch
Do you see the components that depends on most of the other ones ?
- The Punchlines (not at all a diagnostic tool. Why is it not working ?)
- The operator environment (some command may help diagnosis, but various errors can occur).
- The Platform Health monitoring service (actually, this is 100% diagnostic tool)
So you can confirm that everything works well through these. But it may not be easy no understand WHAT the problem is, only from a punchline not working.
Health checking order
So the right order to check is:
Platform Health
Elasticsearch
Zookeeper -> Kafka -> Storm / Shiva
Elasticsearch cluster(s) status
Elasticsearch does not depend on any other component like Zookeeper or Kafka. In addition, many of punchplatform components are writing information to Elasticsearch So we can check this first.
Have a look at the simplest of Elasticsearch REST API
Exercise
Check the health and list of nodes of your training platform elasticsearch clusters.
If you miss some cluster/nodes info, try viewing $PUNCHPLATFORM_PROPERTIES_FILE file.
Answers
# cluster status

$ curl tpesdmst01:9200/_cat/health?v
    epoch      timestamp cluster status node.total node.data shards pri relo init unassign pending_tasks max_task_wait_time active_shards_percent
    1605525834 11:23:54  es_data green           5         3      6   3    0    0        0             0                  -                100.0%

# available cluster nodes :

curl tpesdmst01:9200/_cat/nodes?v

    ip         heap.percent ram.percent cpu load_1m load_5m load_15m node.role master name
    10.1.1.241           34          66   0    0.00    0.01     0.05 ir        -      tpesdclt01_es_data
    10.1.1.191           13          82   0    0.14    0.08     0.07 imr       *      tpesdmst01_es_data
    10.1.1.201           57          60   0    0.00    0.01     0.05 dir       -      tpesddat01_es_data
    10.1.1.203           56          59   0    0.00    0.01     0.05 dir       -      tpesddat03_es_data
    10.1.1.202           59          59   0    0.03    0.04     0.05 dir       -      tpesddat02_es_data
Zookeeper cluster(s) status
Zookeeper is the keystone of Kafka and Storm.
If you need some high-level summary of zookeeper design and goals, have a look at Zookeeper Overview
Then you can see zookeeper health/status commands.
Exercise
-
Remote-check the health of your zookeeper test cluster.
-
browse inside zookeeper-stored nodes, to find out where kafka store its cluster information
Answer
Zookeeper browsing can be used for kafka cluster health troubleshooting (see)
Kafka cluster(s) status
Kafka is the persistent, highly-available, replicated data store for:
- business data during the transport/processing stages
- channels control management data (to remember what channels have been started/stopped)
- Shiva cluster management (to remember what tasks have been submitted, what nodes are online, where tasks are assigned)
To assess kafka availability, the easiest is to have a look at the availability state of the existing
topics. This is done through the --describe subcommand of punchplatform-kafka-topics.sh
More health checking/troubleshooting means are provided by a specific HOWTO.
Exercise
Check your training platform replication status of all topics.
Storm cluster status
Storm is a computation farm for scalable, highly available processing. Best way to confirm the cluster health and available slaves (supervisors) nodes is to use the Storm UI Web HMI)
Shiva cluster status
Shiva is a lightweight Punch-specific task scheduler, that can be used in complement or replacement to Storm.
It runs whatever commands you want, on one of the "runner" nodes. One of the shiva node acts as "leader" and design where tasks are assigned.
A kafka-based protocol is used (in production only) to communicate with and within the cluster.
Have a quick look at the basics of Shiva protocol documentation just to understand the different Kafka topics used by Shiva.
What are the Shiva management kafka topics
Answer: the Shiva management topics
- platform-shiva-
-cmd: "Command topic" contains start/stopscoming from channelctl - platform-shiva-
-ctl: "Control topic" contains I am alive messagesfrom nodes - platform-shiva-
-assignments: periodic decisions statusfrom the leader
Exercise
Following How to check Shiva Health documentation check the health of a shiva cluster on your training platform
When platform is fully configured: the monitoring dashboards
Of course, once all your platform components are running, we normally deploy platform monitoring channels to provide synthetic/centralized information about the running status of the framework.
This will be detailed in the MON Training module. Otherwise you can refer to