Kibana Dashboard
A Kibana dashboard is a collection of visualizations that you can arrange and share. LMC starts with dashboards, which are fully customisable and security oriented, so you can create your personal dashboard based upon saved visualizations.
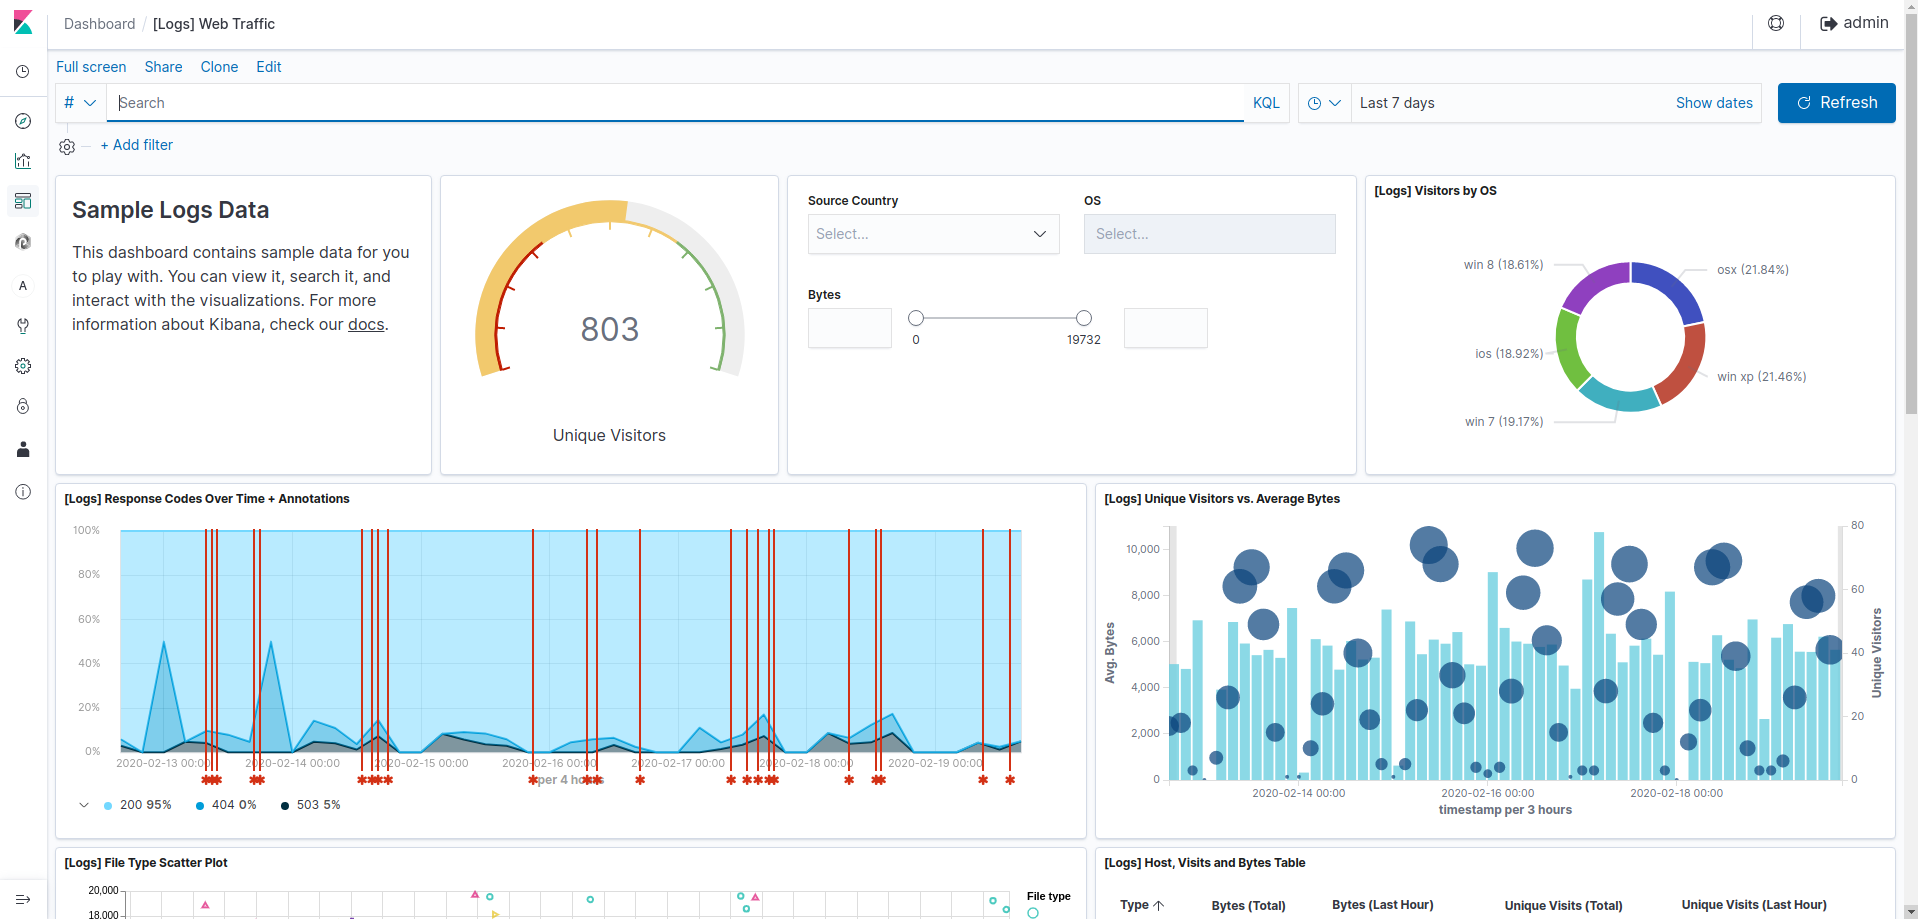
To get started, click the Dashboard tab, then the Add Visualization button at the far right of the search box to display the list of saved visualizations. Select your saved visualizations, then close the list of visualizations by clicking the small up-arrow at the bottom of the list. You can move the containers for each visualization by clicking and dragging the title bar. Resize the containers by dragging the lower right corner of a visualization's container. Your sample dashboard should end up looking roughly like this:
Click the Save Dashboard button, then name it.
Now that you've handled the basic aspects of Kibana's functionality, you're ready to explore Kibana in further detail. Take a look at Elastic 's online documentation for more details!