Kibana Discover
The view is a good staring point. Its aim is to look for data, search and filter it, in order for you to select the subset of data you are interested in.
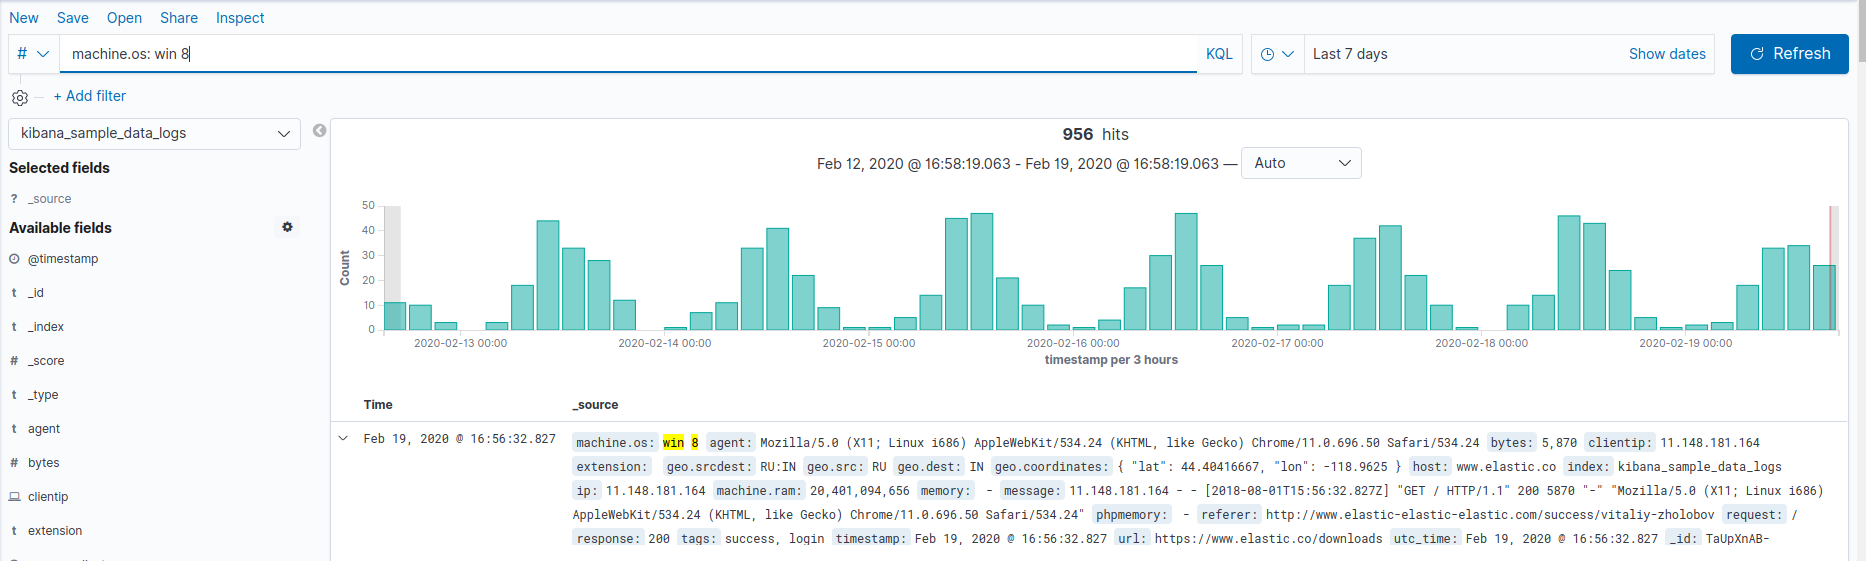
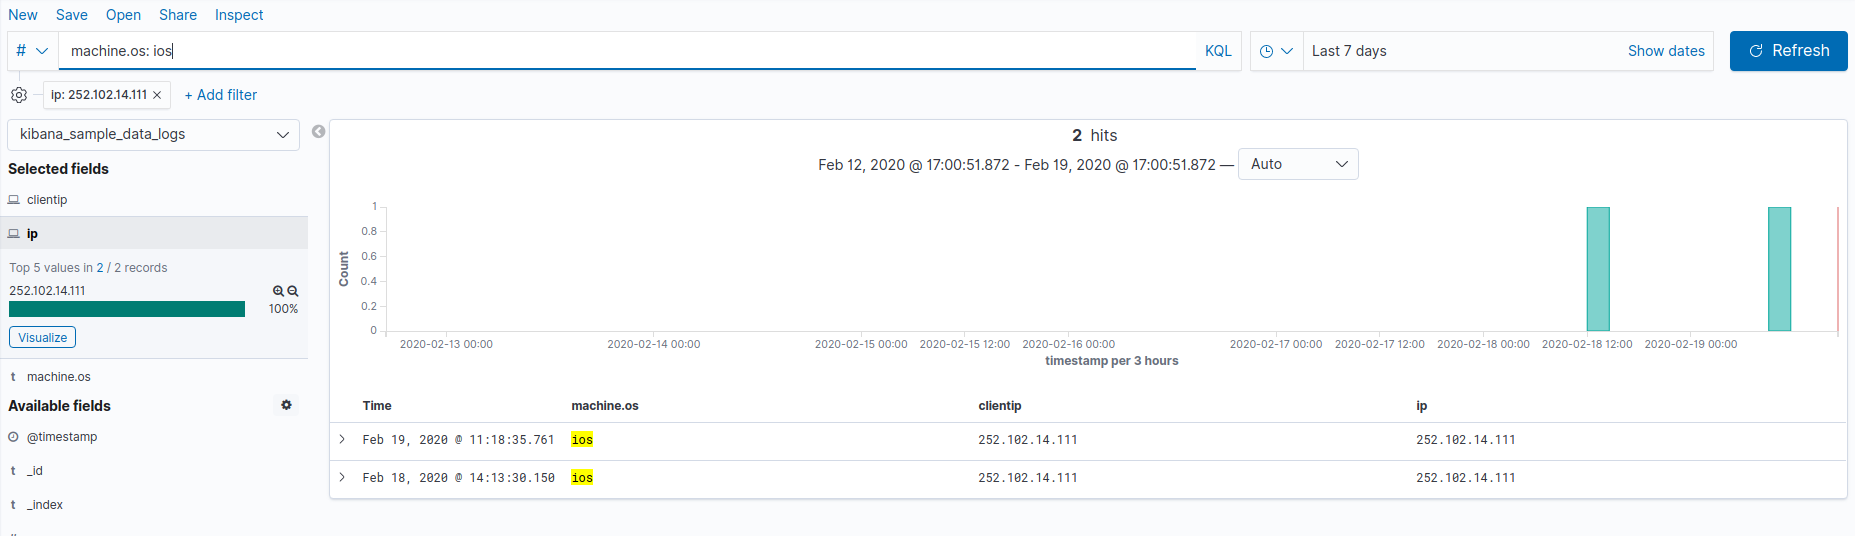
Here is a breakdown of the Kibana Discover elements:
- Search Bar: Directly under the main navigation menu. Use this to search specific for fields and/orentire messages;
- Time Filter: Top-right (clock icon). Use this to filter logs based on various relative and absolute time ranges;
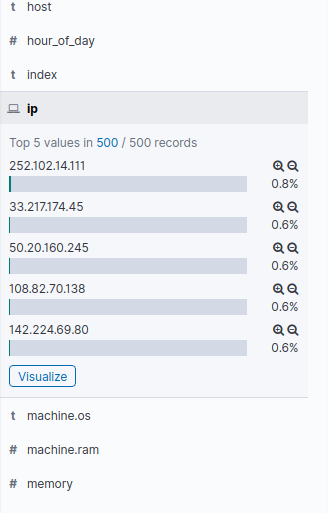
- Field Selector: Left, under the search bar. Each available field for logs matching your filtering are displayed there; by clicking on a field, it will display the top 5 most present values,
- Date Histogram: Bar graph under the search bar. By default, this shows the count of all logs,versus time (x-axis), matched by the search and time filter. You can click on bars, or click-and-drag, to narrow the time filter. This uses the statistical scheme.
- Log View: Bottom-right. Use this to look at individual log messages, and display log datafiltered by fields (hover a field in the Field Selector and click on the button). To remove a field, click on the cross next to an hovered column name. If no fields are selected, entire log messages are displayed.
Kibana allows you to search Elasticsearch data via the Lucene Query
String syntax. Queries can be run via the query input at the top of the
page. In short, each criterium can be separated by AND or OR connectors,
and each condition of filtering is formatted as
[
<key>is a field amongst all the Normalization possible fields, whose list can be found on the field selector left bar.- [
] is a string or number matching your need. You can look for simple words (e.g. the brown fox jumps).
For example, vendor:apache_httpd.
You can express complex searches :
- with AND/OR:
vendor:exchange AND type:sys - or parenthesis:
vendor:(exchange OR checkpoint) AND type:sys - Numeric ranges can also be easily searched:
_id:[30000 TO 80000] AND vendor:exchange - And of course to search everything:
*
!!! note
You can experience unproper behaviors while using wore Lucene
features. Indeed, for performance purposes, Elasticsearch has
wrapped some features in its Query
DSL
scheme. For instance, globbing "user": "to*" in the search bar may
not work directly, you shall use the query directly in
the query DSL syntax. :
{
  "query": {
    "wildcard" : {
       "user" : "ki*y"
    }
   }
}
If you want to search for a string (several words), you need to add
double quote character at the beginning and end of the string. For
example: init.useragent:"Windows NT 6.1".
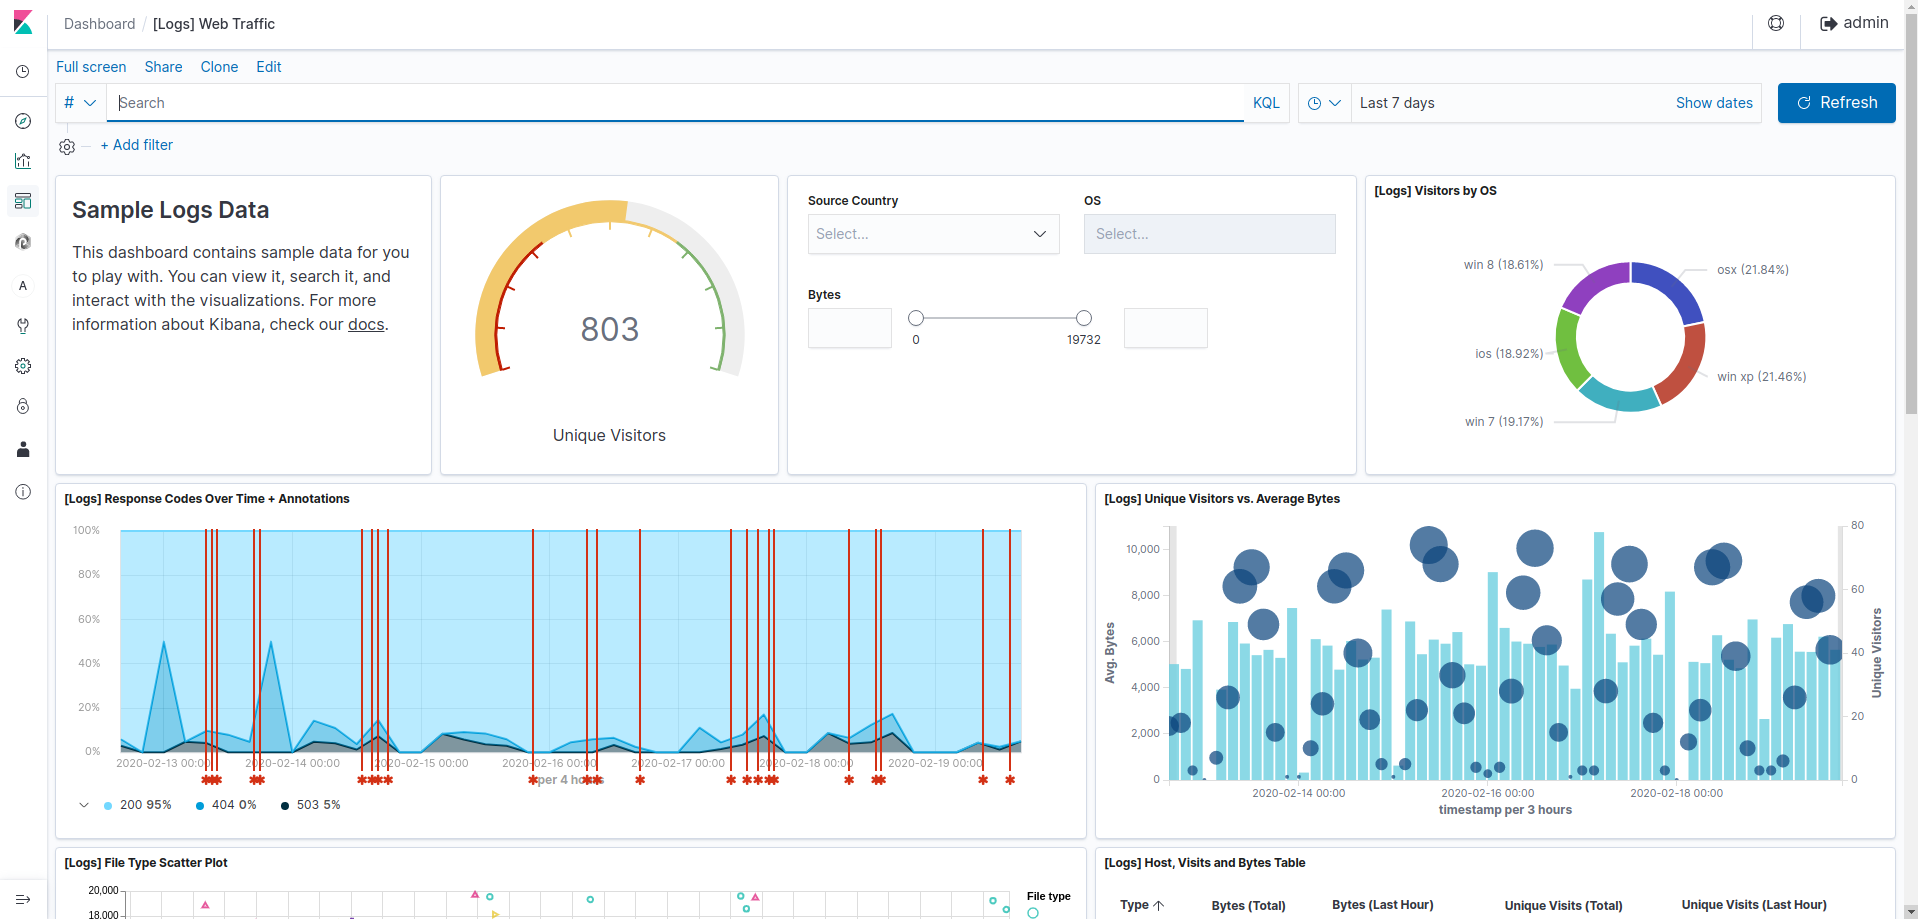
For more Lucene syntax explanations, please refer to :Apache Lucene Queries and tables will display the results to your query. Queries and filters enable constraining the data displayed on the charts and tables. Kibana supports Lucene Query String syntax, as well as making use of some of Elasticsearch's filter capabilities.
As you enter the value, the date histogram and the log view updates matching the query.
Additionally, you can add a new filter directly by clicking on the magnifying glass, either next to a field 's top 5 in the Field Selector, or next to a field directly on an entry in the Log View. Use the glass with a '+ ' to filter any logs matching that value, and the '- ' for those which are not.
You can manage your filters by hovering the filter that appeared on the other part of the screen. Five options are available (from left to right):
- Checkbox: enables or disables this filter;
- Pin: Allows you to keep this filter across every view: visualisations, dashboards ... Very useful if you want to get reports for a certain subset.
- Magnifying glass: Toggles the filtering (inverts the filter);
- Trash: Discards this filter;
- Pencil: Edits this filter.
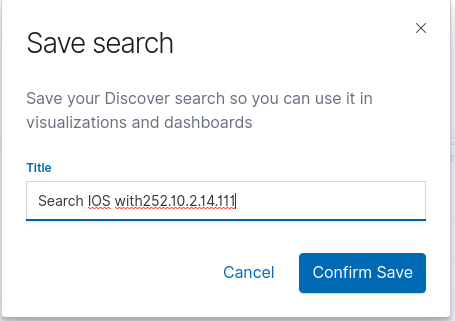
You can save your searches in order to re-use them in your visualizations by clicking on the icon and putting a name on it.